摘要
实验室技能对于表征和验证ADI公司电源转换器产品的出色性能至关重要。如果没有精确的测量技术,工程师在评估不同解决方案时就无法获得必要的信息,从而难以做出明智的决策。本文讨论了如何谨慎选择用于测量的无源探头,以及如何优化测量方法,并介绍了有助于进一步诊断转换器运行情况的替代测量技术。文中展示了参考设置,以说明如何获得典型的数据手册数据,例如电压纹波和开关波形。
简介
评估开关模式电源(SMPS)时,需要评估许多关键参数。观察特定测量结果时,也需要考虑许多因素。为了确保设计决策不受错误数据干扰,请务必准确执行这些测量,而正确选用示波器探头则是首要步骤。
示波器探头选择
示波器是工程师用来评估SMPS性能的强大工具。然而,正确的测量技术对示波器采集精度的重要性,再怎么强调都不为过。第一步是为要进行的测量选择合适的示波器探头。
无源探头用途广泛,能够准确测量信号,并且由于不包含有源电路,所以无需外部电源。有源探头可以大大降低测量操作对极其敏感电路的干扰,但此类探头也更复杂、更昂贵。本部分将探讨使用无源10倍探头、无源1倍探头和同轴电缆进行的示波 器测量,并简要讨论对于某些测量操作,如何确定应选用哪一种探头。
示波器探头:10倍
10倍探头是大多数现代示波器的通用标准探头。之所以称为10倍,是因为它们的衰减比为10:1,可以将被测信号缩小为十分之一。示波器的显示屏会根据衰减程度进行调整,以显示正确的电压测量值。但用户应注意验证,因为不同型号的示波器可能存在差异。探头具有较大的内部阻抗,它与示波器的阻抗一起将电压信号衰减为1/10,如图1所示。这种高阻抗降低了示波器的负载,也让探头可以正常测量通常高达数百伏的高电压。10倍探头的典型带宽达到数百兆赫兹。例如,Keysight N2873A 10倍探头的额定直流电压为400 V,频率高达500 MHz1。


此外,必须小心检查探头的电压降额曲线与频率的关系。电压降额曲线表示,对于一定频率的信号,探头可以测量的最大电压是多少。随着频率提高,探头可以通过的最大电压将会降低。图2中的曲线为N2873A的示例。


为确保千赫兹频率范围内的测量精度,许多10倍探头都内置有可调补偿螺丝,如图3所示。通过这种探头调整机制,用户可以使探头电容与示波器的输入电容相匹配,Ct/(Cin + Cp) = 1 MΩ/9 MΩ。完成调整后,电压测量将具有正确的频率响应,确保妥善地测量快速边沿,避免出现过冲或欠冲失真。每次将探头连接到新的示波器输入时,都应进行校准,以解决模拟前端的细微差异。即使在同一台示波器的不同通道之间切换,也应进行校准。要校准探头,请将其连接到示波器的板载方波发生器,并调整探头的补偿螺丝,直至观察到的电压信号呈现方形,且几乎没有过冲或圆角,如图4所示。


10倍探头能够传递更高的频率和电压,特别适合用于测量SMPS中的开关节点电压,也可用于测量 VIN、VOUT和高频信号电平波形。
示波器探头:1倍
另一种常见的无源探头是1倍探头,如图5所示。此类探头的衰减比为1:1,即不会衰减电压信号。与10倍探头相比,这些探头的阻抗要低得多,并且不需要用户校准。示波器不会调整其测量比例,因此屏幕截图的分辨率更加精细—通常低至1 mV/div。


这些探头的电压范围为几十伏,带宽通常为几十兆赫。例如,Fluke PM9001 1倍探头的阻抗小于1 kΩ,最大电压为30 V,带宽为15 MHz2。建议将1倍探头用于低压和低频测量。测量SMPS中的电压时,建议使用此探头进行小信号测试,例如输入或输出电压纹波,只要这些纹波的频率在较低的兆赫兹范围内即可。
同轴电缆
10倍和1倍探头通过同轴结构的电缆连接到示波器。同轴电缆的中心导线用于传输信号,外层金属编织网用于屏蔽电缆和信号,使其免受电磁干扰(EMI)。经过适当端接,同轴电缆本身也可以用作电压探头,如图6所示。这些电缆通常具有50 Ω的特性阻抗,因此示波器输入阻抗必须设置为50 Ω。


在示波器中应用50 Ω阻抗设置时,示波器可以支持的最大电压会受到限制,通常为5 V。此限制可保护示波器免于过载。尽管同轴电缆测量仅限于低电压范围,但其传递的带宽却要高得多。Pomona 2249-C-12 BNC-BNC电缆的带宽为4 GHz,高于许多示波器探头的带宽3。
为将同轴电缆用于SMPS测量,印刷电路板(PCB)本身必须配备合适的匹配连接器。这意味着必须提前设计电路板,留出足够的空间来容纳或插入连接器。适用于演示板测量的同轴电缆有多种样式,其规格和连接器类型各不相同。
许多ADI μModule®演示板采用直径10 mm的BNC连接器。母头BNC-BNC坚固可靠且易于获取,因此常用于示波器测量。这些同轴电缆通常用于测量SMPS输出端的动态负载电路中的VOUT纹波。超小B型 (SMB)和Uf.l连接器是两种专门用于高频测量的连接器,而且因其体积较小,所以也同样适用于空间紧张的PCB设计。
探头选择总结
10倍探头建议用于捕获高电压和进行一些高频测量。对于小电压和低频测量,建议使用1倍探头。同轴电缆适用于低压和高频测量,但需要在PCB上的测试点配备连接器。表1总结了这些差异。
| 10倍探头
(Keysight N2873A) |
1倍探头
(Fluke PM9001) |
同轴电缆 (Pomona 2249-C-12) |
|
| 电压范围 | 400 V | 30 V | 5 V (示波器限制) |
| 带宽 | 500 MHz | 15 MHz | 4 GHz |
| 允许校准 | 是 | 否 | 否 |
| 需要PCB连接器 | 否 | 否 | 是 |
| 推荐用途 | 高频,高压 | 低频信号, 小信号电压 | 高频信号, 小电压 |
测量电压纹波
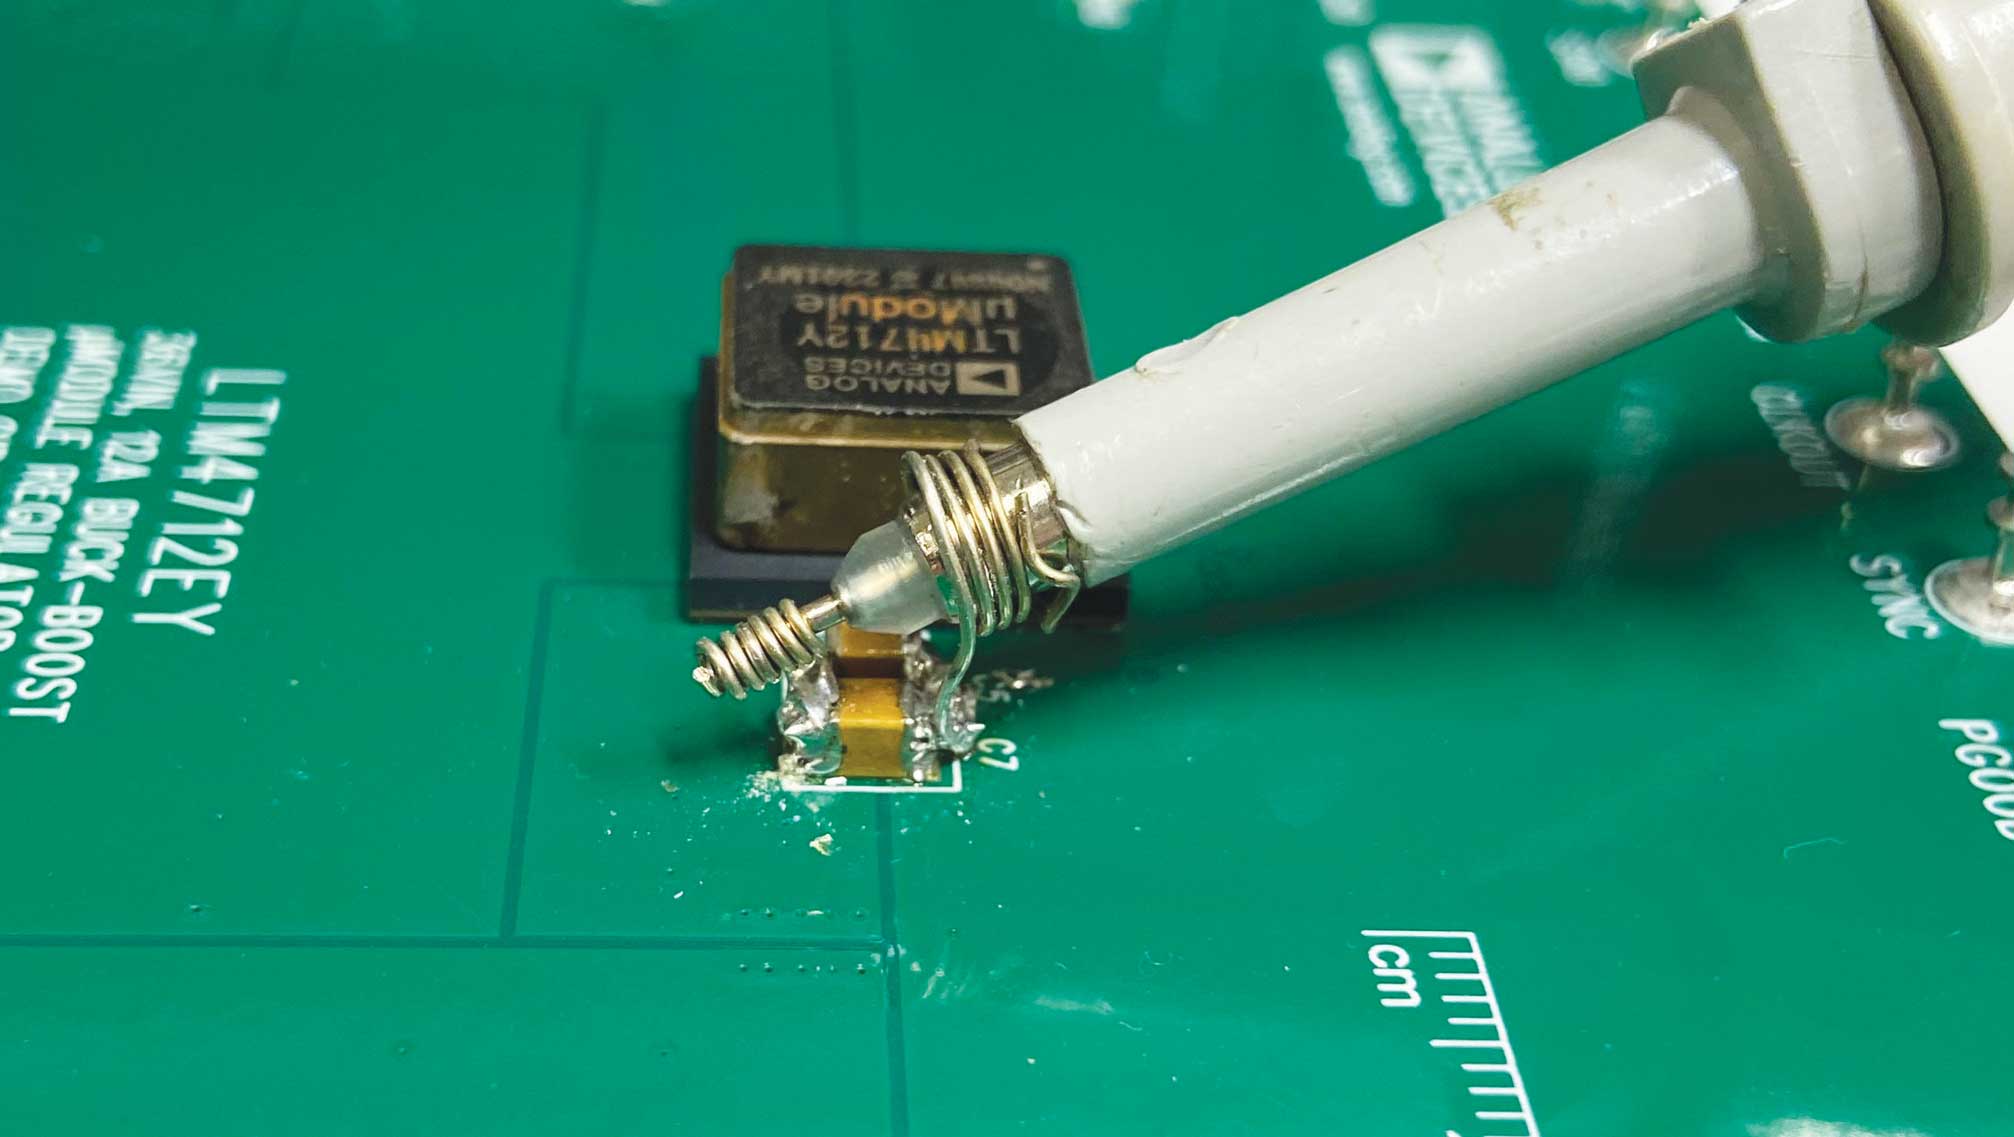
输出电压纹波是电源的一个主要规格,也是用于比较不同设计的一个主要参数。测量几十毫伏或更小的纹波时,电路板上的测量位置和测量方法会显著影响结果。如果电压低于5 V,并且评估板上有合适的连接器,则可以使用同轴电缆来测量输入或 输出纹波。否则,10倍探头和1倍探头都是不错的选择。然而,这些探头的标准接地夹会形成较长的测量环路,导致探头阻抗增加,测量精度降低。建议使用尾纤引线进行此测量,且其应与探头尖端和接地环牢固接触,如图7所示。在图8中可以看到使用标准探头接地连接和使用尾纤引线的测试结果的差异。将标准总线导线缠绕成紧密的线圈便可作为尾纤。应避免在探头本身上制作示波器尾纤,否则可能会损坏探头。


通常在器件的输出电压检测点上测量输出电压纹波。在μModule演示板中,可在电路板下方、SMPS输出正下方的陶瓷电容上采集优化的最小纹波。与在bulk电容两端进行测量相比,在陶瓷电容上测量得到的等效串联电阻(ESR)产生的纹波更小。通过在电路板底部(与转换器相对)进行测量,电路板本身可以屏蔽EMI噪声。在其他应用中,用户可能希望在远离转换器的位置(例如施加负载的地方)测量输出电压纹波。与在转换器旁边测量相比,由于PCB的寄生效应和此测量位置的电容量,相关输出电压纹波的形状会有所不同。
输入电压纹波应在最靠近IC的输入电压电容两端测量,因为这会直接测量IC的输入电压。出于类似原因,该测量应使用示波器探头尾纤。
测量开关节点波形
正确测量开关节点至关重要,因为不当的测量技术会产生不正确的波形,较常见的是引入假振铃,这可能会破坏调试工作。为了防止这种情况,应使用短尾纤引线将示波器探头接地。但通常开关节点旁边不太方便设计接地。为了解决这个问题,可从开关节点旁边的接地平面上刮掉一小块阻焊层,并在新暴露的接地上安装一根尾纤,以用于测量。执行此操作时,注意不要让开关节点短路至地。在图9中可以看到使用标准探头接地连接和使用尾纤引线测量的开关节点波形的差异。


在某些μModule器件中,为减小解决方案的体积,开关节点集成到了器件中,无法直接接入,例如单通道、2 A降压转换器 LTM8050。对于这些器件,通过在μModule封装上方放置浮空示波器探头, 仍然可以查看开关节点波形形状。这种方法会对波形形状进行耦合测量,通过波形可以查看开关频率并检查逐周期稳定性。这种耦合波形无法准确测量电压幅度。


10倍探头通常更适合用于测量开关节点,因为信号的频率或幅度通常较高,1倍探头无法测量。
结论
对于大多数需要升压或显著降压的应用而言,SMPS是首选电源电路—因为在噪声性能、效率和解决方案尺寸方面,SMPS在很多情况下能够实现最优组合。设计SMPS电路时需要做出大量决策,并且需要精确测量关键参数,以获取决策所需信息,从而确保做出正确的选择。
参考电路
“开关模式电源基础知识”。ADI公司,2007年9月。
Aldrick Limjoco。“了解开关稳压器输出伪像,加快电源设计 ”。 《模拟对话》,第48卷第8期,2014年8月。
Aldrick Limjoco。“测量开关稳压器中的输出纹波和开关瞬变”。 ADI公司,2013年1月。