Single-IC PWM Modulator Has 2% Linearity
要約
This LED-driver circuit produces a 500Hz PWM signal with 2% nonlinearity and duty cycle adjustable from 0 to 100%, using a 0V-to-5V DC control signal.
A similar version of this article appeared in the August 28, 2008 issue of Electronic Design magazine.
Some LED-driver circuits achieve dimming by applying a variable duty cycle (PWM) to the LED. PWM drive exploits LED behavior: at higher current levels, the LED's light output is higher for a given level of power dissipation (temperature). Thus, applying PWM current to the LED yields an average power comparable to that of DC control, but with higher operating current and greater light output.
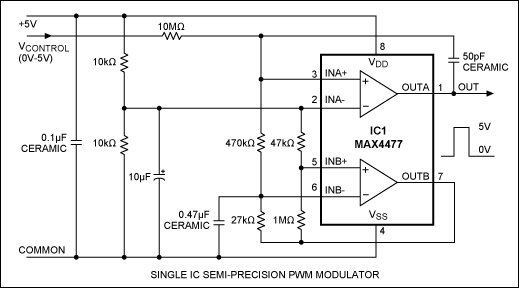
If the available control signal is a DC level, you can implement PWM control with a simple circuit that provides predictable behavior and good linearity (Figure 1). Consisting of a single IC and some external components, the circuit of Figure 1 produces a 500Hz PWM signal with 2% nonlinearity and duty cycle adjustable from 0 to 100%, using a 0V-to-5V DC control signal.

Figure 1. This circuit produces a 500Hz PWM drive for LEDs, controlled by a 0V–5V DC signal./p>
The "B" side of the dual comparator (MAX4477) is configured as an oscillator running at about 500Hz. It produces a triangular waveform at the positive input, whose amplitude is about 1/10 the supply voltage. The "A" side then compares the triangle waveform with the DC control signal, and generates a PWM signal at its output. The PWM generator and DC control-signal generator should be powered by a single +5V supply.
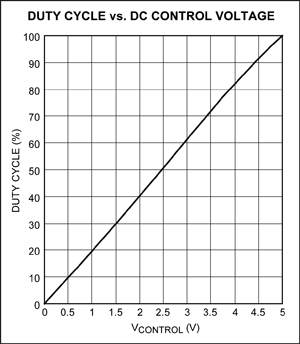
You can adjust the oscillation frequency (f) by changing the value of capacitor C in this equation: f = 6345/RC, where R is in kilohms, C is in microfarads, and f is in hertz. For a PWM signal of 500Hz, for example, C = 0.47µF and R = 27kΩ. Figure 2 shows the circuit response as PWM duty cycle vs. DC control-signal level. For more information, please see the MAX4477 data sheet.

Figure 2. A graph of duty cycle vs. control voltage illustrates the Figure 1 circuit's linearity (about 2%).