Empirically Based Multichannel Phase Noise Model Validated in a 16-Channel Demonstrator
Empirically Based Multichannel Phase Noise Model Validated in a 16-Channel Demonstrator
Oct 1 2021
Abstract
This article details a systematic approach for predicting phase noise in large multichannel systems and compares it with measurements on a 16-channel S-band demonstrator. This analytic approach is based on a small set of measurements that can be used to estimate correlated vs. uncorrelated noise contributions. Based on only a few measurements, phase noise under a wide range of conditions can be predicted. The view is that any specific design will need its own system noise analysis, with the 16-channel demonstrator providing a specific design example to use as a basis. Assumptions based on the 16-channel demonstrator are discussed along with limitations about when the assumptions apply and when to add additional noise terms as system complexity grows. The description provided builds on a body of work describing phase noise optimization in RF systems.1–6 Where appropriate, references describing the foundational principles used in this analysis are provided.
Introduction
Phase noise is a key performance metric in all RF system designs. In large multichannel RF systems such as phased arrays where channels combine coherently, one objective is to achieve array-level dynamic range improvements from the coherent combination of distributed receivers and transmitters. A system engineering challenge with this objective is accounting for noise terms that are both correlated and uncorrelated in the system. This article is intended to aid system engineers developing analysis methods to estimate noise performance in large systems by presenting a systematic approach used to estimate phase noise on a 16-channel RF demonstrator.
Any signal within a phased array will contain noise terms that are both uncorrelated across channels and noise terms that are correlated across channels. The additive noise of distributed components is uncorrelated. However, shared signals used for the distributed components create a correlated noise component. The challenge is how to quickly visualize correlated noise terms in an architecture. Anything common or shared can result in correlated noise across channels. Examples include shared LOs, clocks, or power. As system complexity grows, tracking these noise terms becomes quite cumbersome. Therefore, intuitive methods to redraw the architecture from a noise point of view and to quickly identify correlated noise contributors can be beneficial to the system engineers architecting next-generation systems.
In this article we demonstrate an approach with a 16-channel S-band system and show that, with only a few empirical measurements, phase noise under a variety of other channel combination conditions can be well predicted. One of the key points of this empirical model is that some measurements are needed. It can be difficult to go directly from component simulations to large multichannel phase noise estimates with good accuracy. However, with only a few measurements, correlated and uncorrelated noise terms can be extracted such that multichannel estimates can be quite accurate. Our measurements match the predictions within 1 dB for a 16-channel S-band demonstrator.

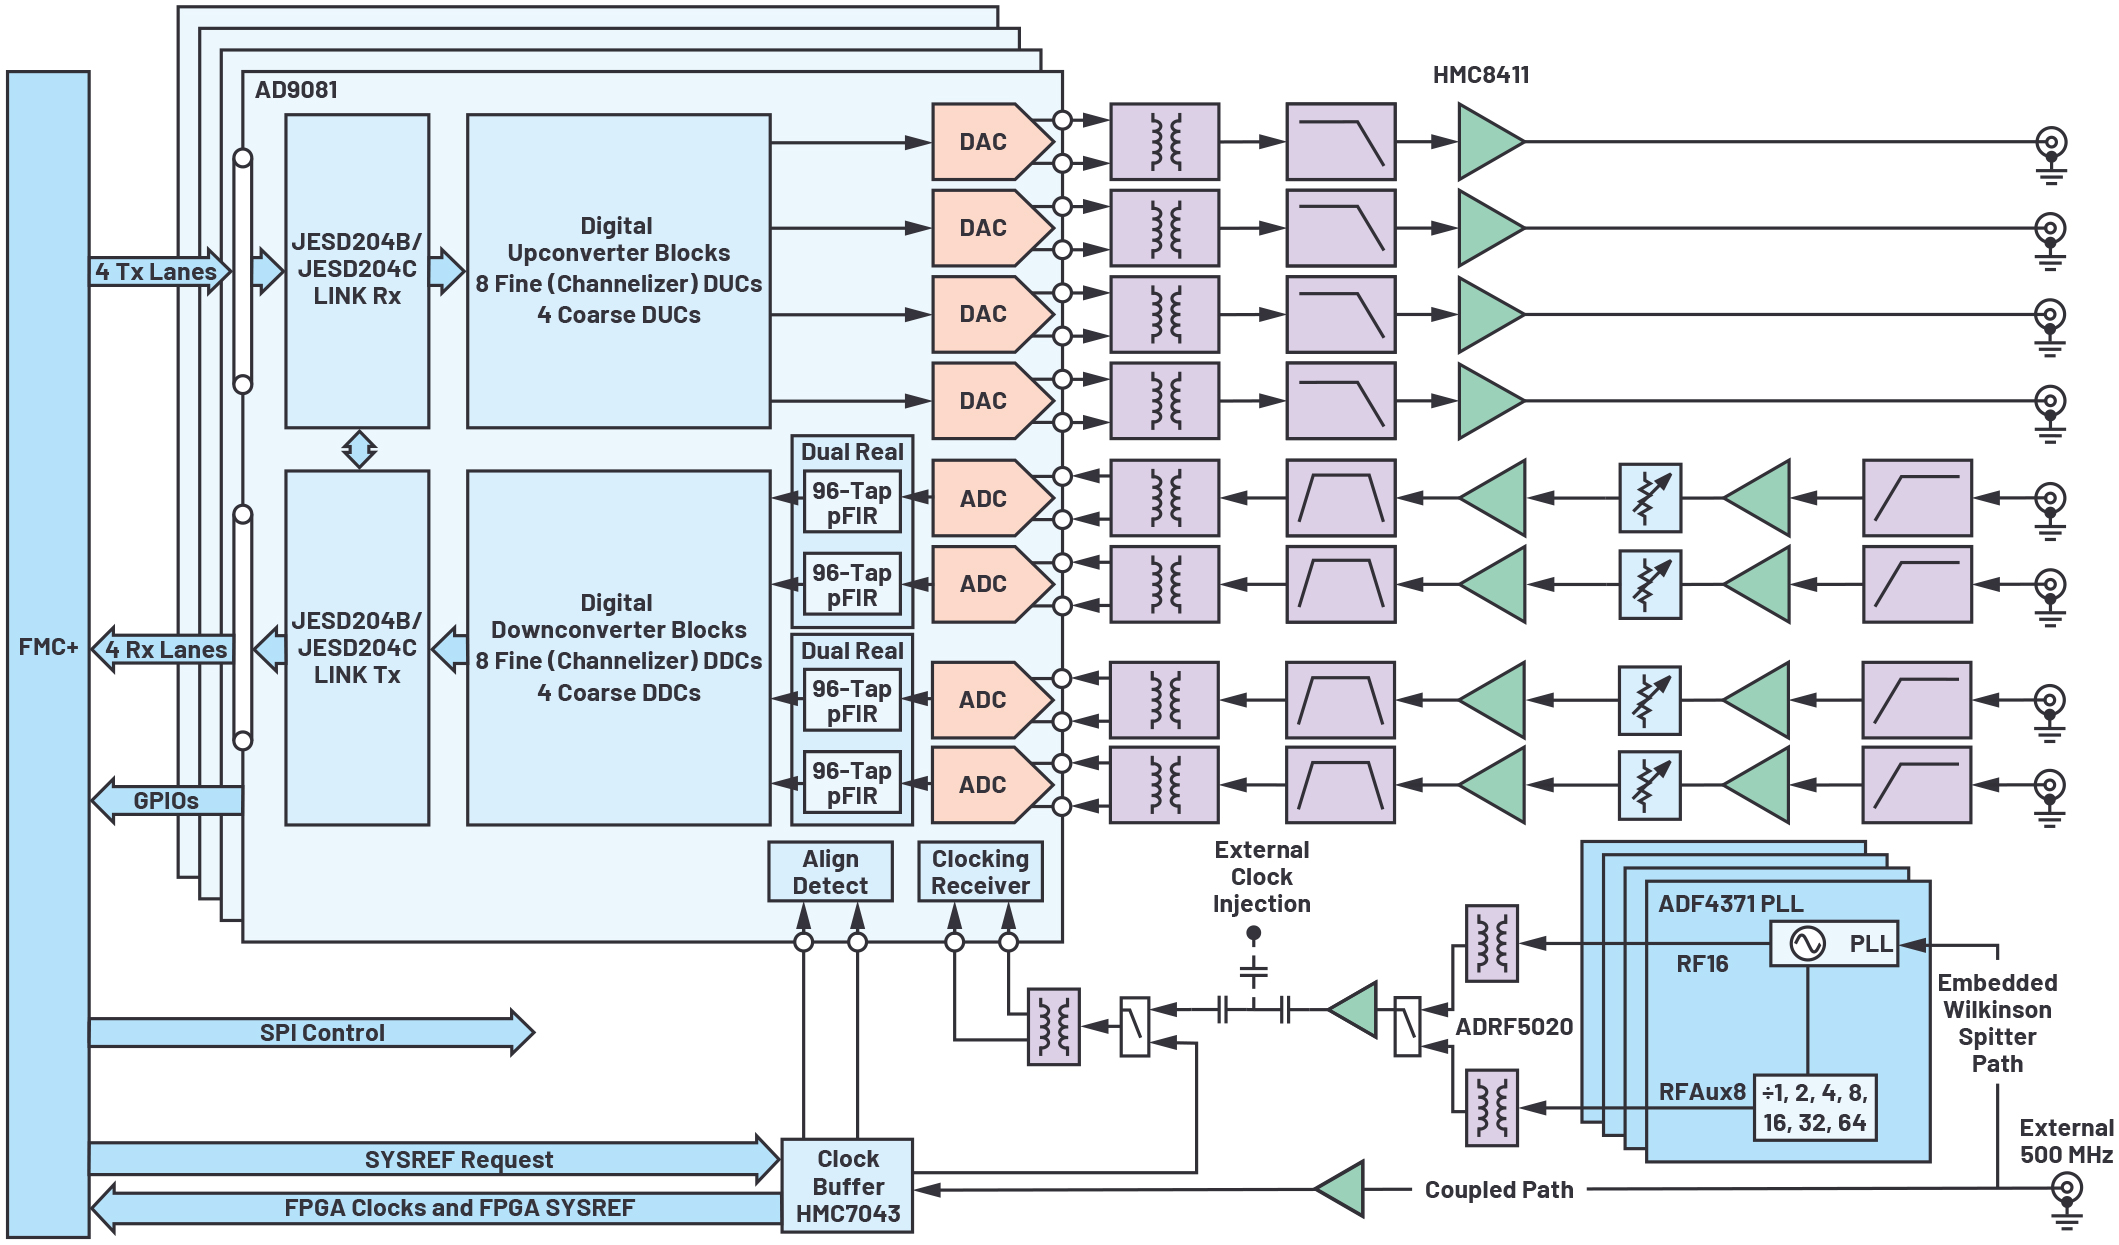
Figure 1. A 16-channel demonstrator: the platform contains four AD9081 ICs. Each AD9081 contains four RF DACs and four RF ADCs that provide a total of 16 transmit and 16 receive channels.
Background on Summing Correlated and Uncorrelated Noise
When signals are combined either in free space or in RF processing, the noise of each signal adds as

where c is the correlation coefficient and ranges from –1 to +1. If c = –1, the noise cancels; if c = 0, the noise is uncorrelated; and if c = 1, the noise is completely correlated.
Assuming there is a calibration to coherently combine the primary signals, the primary signal will increase at a level of 20logN, where N is the number of channels.
- If the noise terms are uncorrelated (c = 0), the noise will increase 10logN. With the signal level increasing at a 20logN rate (10logN greater rate than the noise), the resulting SNR improvement is 10logN.
- If the noise terms are correlated (c = 1), the noise will also increase at a 20logN rate, the same as the signal, and there will be no SNR improvement. This is not a desirable result for distributed systems.
- In noise cancelling circuits, a negative correlation coefficient is created. This case is noted for the sake of Equation 1, but not described further.
In practice, large distributed systems have noise components that are partially correlated across channels. However, a practical and intuitive approach to develop a system-level noise model is desired.
The 16-Channel Demonstrator
A 16-channel direct S-band RF sampling platform was developed to evaluate the latest high speed data converters in a multichannel environment. The platform contains four AD9081 MxFE® (mixed-signal front end) ICs. Each AD9081 contains four RF DACs and four RF ADCs, providing a total of 16 transmit and 16 receive channels.
The 16-channel evaluation platform is named Quad-MxFE for its four MxFE ICs. The overall block diagram and a board photograph are shown in Figure 1 and Figure 2, respectively.

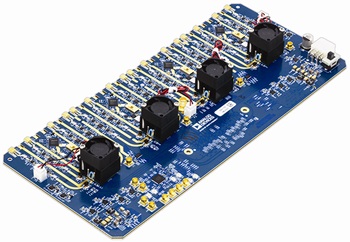
Figure 2. The Quad-MxFE is a 16-channel demonstrator.
Multichannel Phase Noise Model
The 16-channel development platform block diagram in Figure 1 shows the range of capability. From this diagram, it is not initially obvious how to visualize the noise contributors in terms of correlated vs. uncorrelated noise components. A method is needed to consider the architecture from a noise point of view. An appropriate sketch can clarify noise terms that are common across all channels, noise terms that are correlated only across groups of channels, and noise terms that are completely uncorrelated across channels. Figure 3 provides an illustration of the 16-channel development platform and breaks noise terms into three categories.

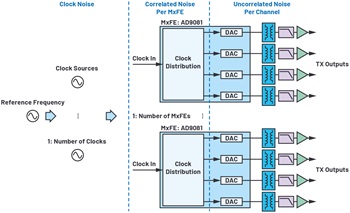
Figure 3. Figure 1 redrawn from a clock phase noise point of view.
- Clock Noise: The Quad-MxFE provides options for multiple clock configurations. The specific configuration used needs to be accounted for in the phase noise model. In our testing, we used either a single, common low phase noise clock across all channels or four separate distributed ADF4371 phase-locked loop (PLL) synthesizers to serve as the clock input to each of the four MxFEs. For a single common clock, this noise will be correlated for all 16 combined channels. For the case of using the four ADF4371 PLLs, one per MxFE, the PLL noise will be correlated per MxFE but uncorrelated across MxFEs, while the reference noise will be correlated across all channels.
- Analysis methods to deal with distributed phase-locked loops are summarized in Peter Delos’ article, “System-Level LO Phase Noise Model for Phased Arrays with Distributed Phase-Locked Loops.” The analysis method in this reference accounts for the noise components of the reference frequency, the distribution system, and the PLL circuitry, and accounts for PLL loop bandwidth effects.
- Correlated Noise per MxFE: This is noise from the MxFE that is correlated for each channel within the MxFE. For this analysis, the correlated noise per MxFE includes both additive noise common within the IC as well as any power supply effects that are common for the channels within the IC.
- Uncorrelated Noise per Channel: This is noise that is different per channel. It includes the DAC core and all amplifier residual phase noise. In Equation 2, this term is annotated as TXNoise.
Based on the phase noise in terms of the contributors described, the combined phase noise can be calculated as follows.
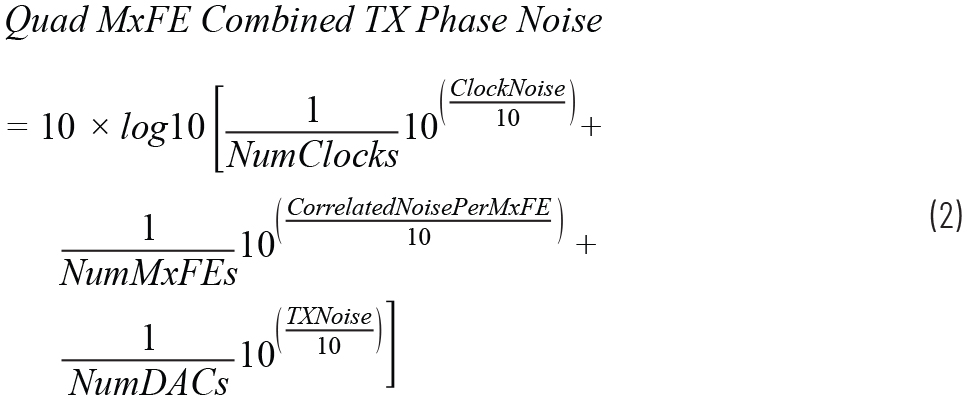
Next, there are a few additional details that allow for the simplification of the model to this form for this testbed.
- Power Supply Effects: Power supply phase noise contributions can be a significant consideration in low phase noise design. Approaches to address the power supply noise concern are described in the articles “Power Supply Modulation Ratio Demystified: How does PSMR Differ from PSRR?”and “Improved DAC Phase Noise Measurements Enable Ultralow Phase Noise DDS Applications.” For the analysis in this article, the power supply effect is considered to be a subset of the noise terms captured in Equation 2. If power supply noise is a dominant phase noise contributor for ICs and it is shared across channels, then this effect will need to be accounted for as a correlated term similar to the correlated noise per MxFE used earlier in this article.
- Reference Oscillator Noise: In large systems, the reference oscillator noise contribution needs to be allocated as described in the article “System-Level LO Phase Noise Model for Phased Arrays with Distributed Phase-Locked Loops.” In this testbed, a very low phase noise reference was used, which was well below the other contributors and not specifically called out in the combined noise equation.
Measurements to Inform Model
With the combined phase noise model now described in Equation 2, the next question is “How do we arrive at the noise contribution values to use in the equations?” In the case of the Quad-MxFE testbed, three measurements can be used to extract the information needed:
- The absolute phase noise of the clock source
- The residual phase noise of channels from different MxFEs
- The residual phase noise of channels from the same MxFE
The test setups used along with the measurements are shown in Figure 4. Both Figure 4(b) and Figure 4(c) provide residual noise measurements that cancel the common clock source. When measuring residual phase noise within a single MxFE, the correlated noise across channels within the MxFE is also cancelled. However, when measuring residual phase noise across MxFEs, the correlated noise in the MxFE is captured in the measurement.

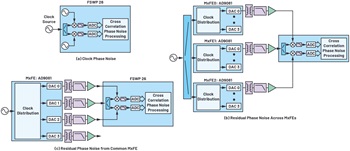
Figure 4. Three measurements are used to inform the phase noise model.
The final step is to modify the measured data into the three terms for Equation 2 as follows:
- Clock noise = clock phase noise measurement (Figure 4(a)) + 20log(FOUT/FCLOCK)
- Correlated noise per MxFE = residual phase noise across MxFEs (Figure 4(b)) – residual phase noise from a common MxFE (Figure 4(c)). Note that, for this calculation, you will need to convert to linear power, then subtract, then convert back to dB such that 10log(10^(residual phase noise across MxFEs/10) – 10^(residual phase noise from a common MxFE/10))
- TxNoise = residual phase noise from a common MxFE (Figure 4(c)).
An additional comment on the residual phase noise measurements: We found with this hardware that the noise terms of items 2 and 3 above also scale with frequency. When translating to other frequencies, an additional 20log(FOUT/FMEAS) is needed. This may not necessarily be the case for all hardware and this term should be evaluated independently for every design.
Measurement Case 1: A Common Low Phase Noise Clock
For this measurement, a single low noise 12 GHz clock was used for the entire 16-channel demonstrator. The clock source was an SMA100B and was injected in the external clock injection node shown in Figure 1. The conditions shown are for a 3.2 GHz transmit output frequency.
From Figure 5(b), we see the correlated noise across MxFEs is the highest contributor. As MxFEs are added in the system, this noise contribution will improve and then become limited by the common clock noise. With the curve shapes of each contributor, adding only a few points along the curve is not quite sufficient for an accurate prediction, and so we found it best to use the data of Figure 5(b) directly in Equation 2. Next, a series of measurements was conducted to validate the model. The model predicts the results with surprising accuracy, as can be observed after reviewing Figure 6 through Figure 8.

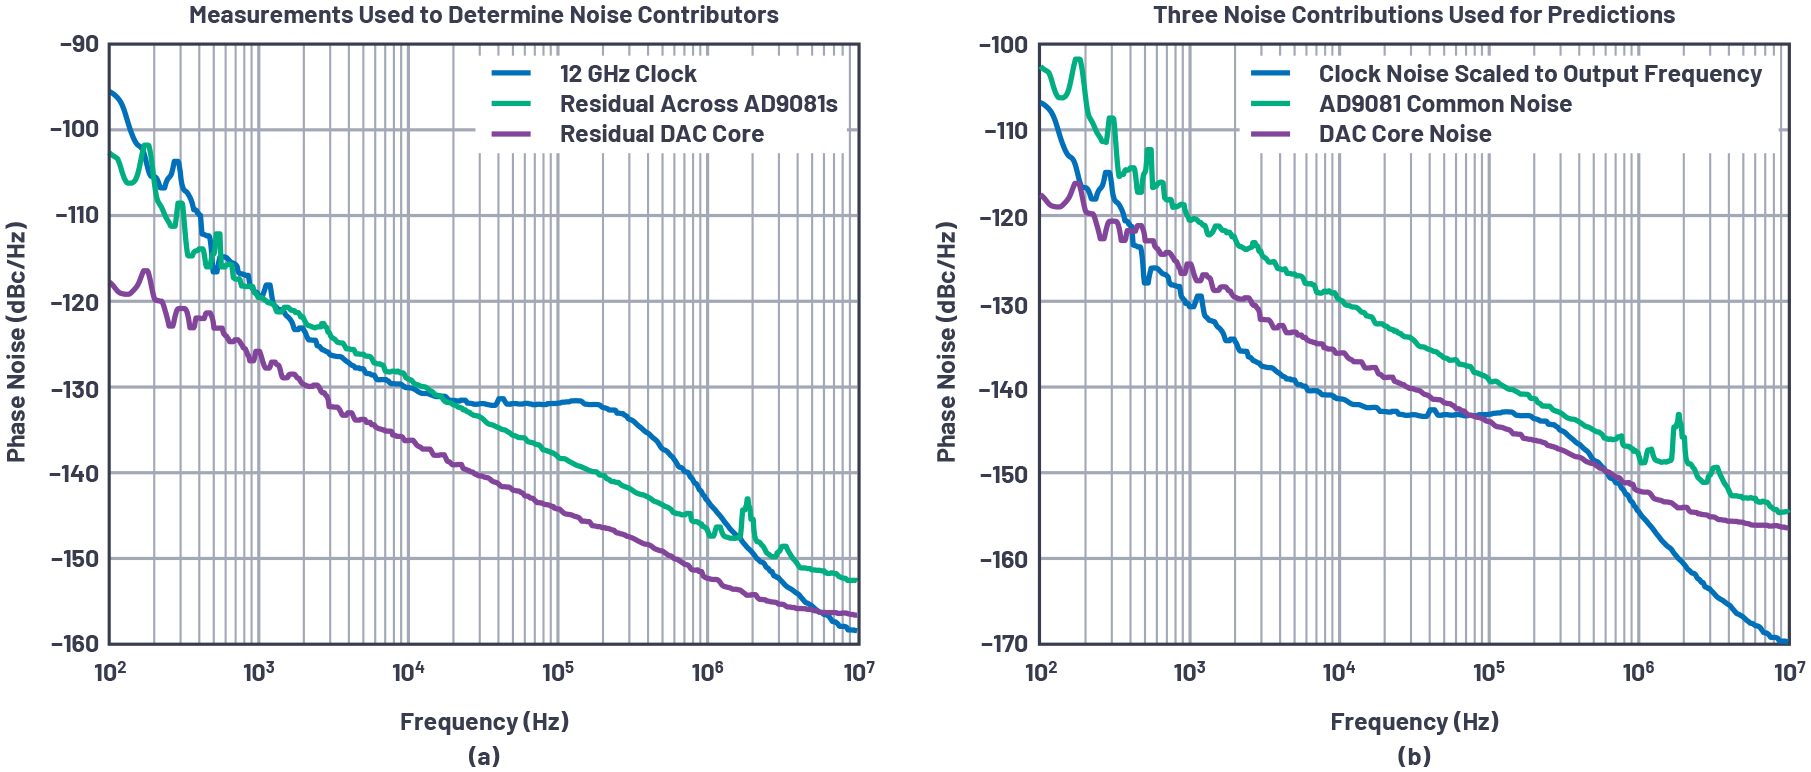
Figure 5. a) Measurements made to inform the phase noise model, and b) calculated phase noise contributors to use in the model. This is for the case of a single, common clock to all MxFEs.

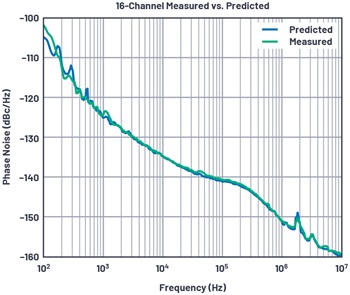
Figure 6. Measurement vs. model predictions for 16 channels at 3.2 GHz.

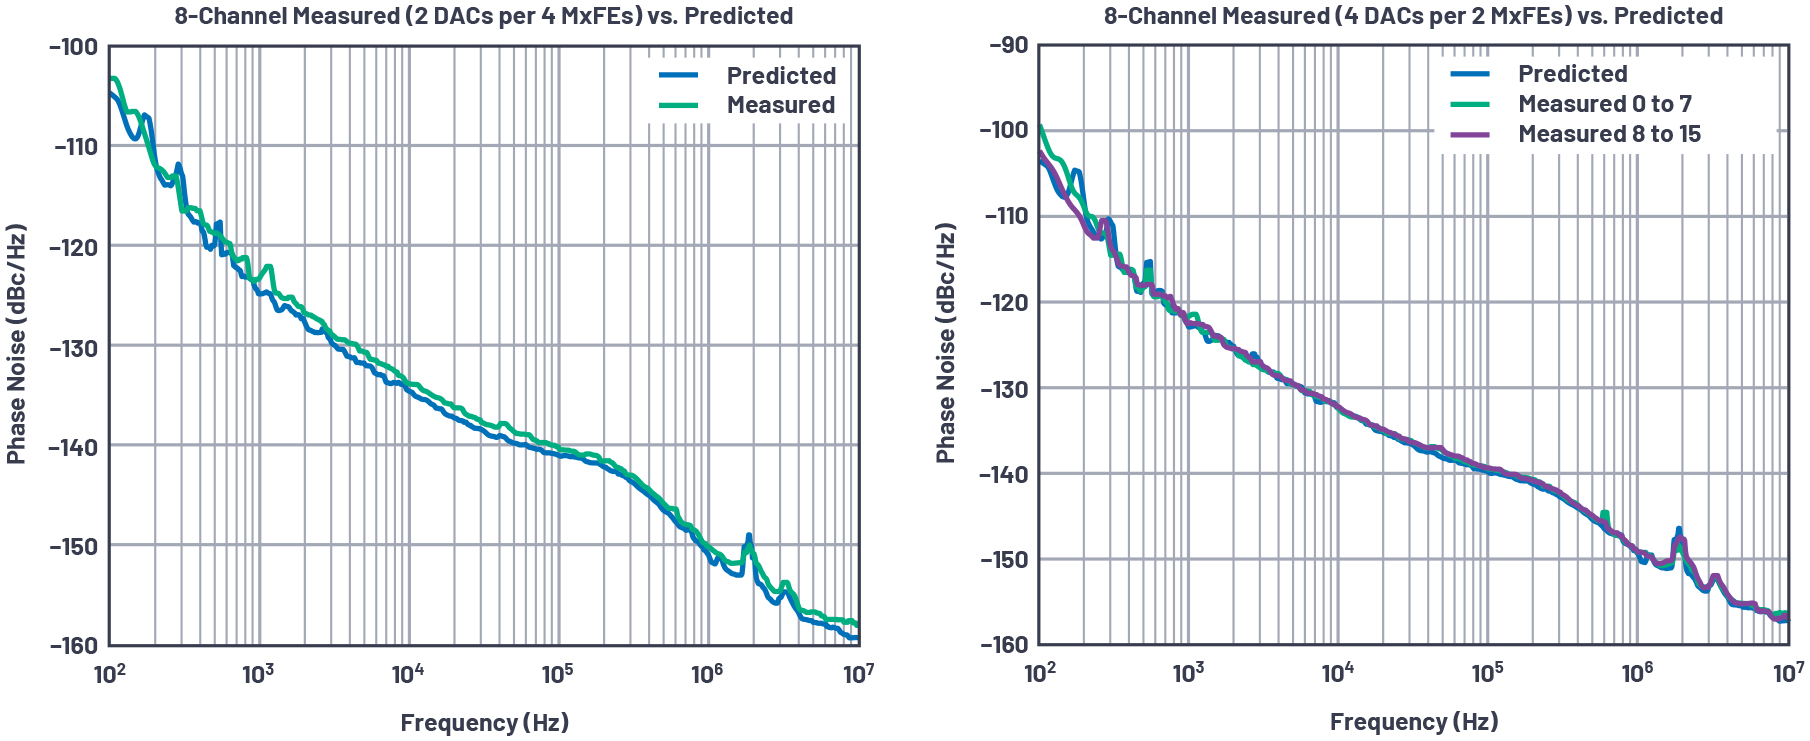
Figure 7. Measurement vs. model predictions for eight channels at 3.2 GHz. The difference in the two plots is how transmit channels are shared across MxFEs.

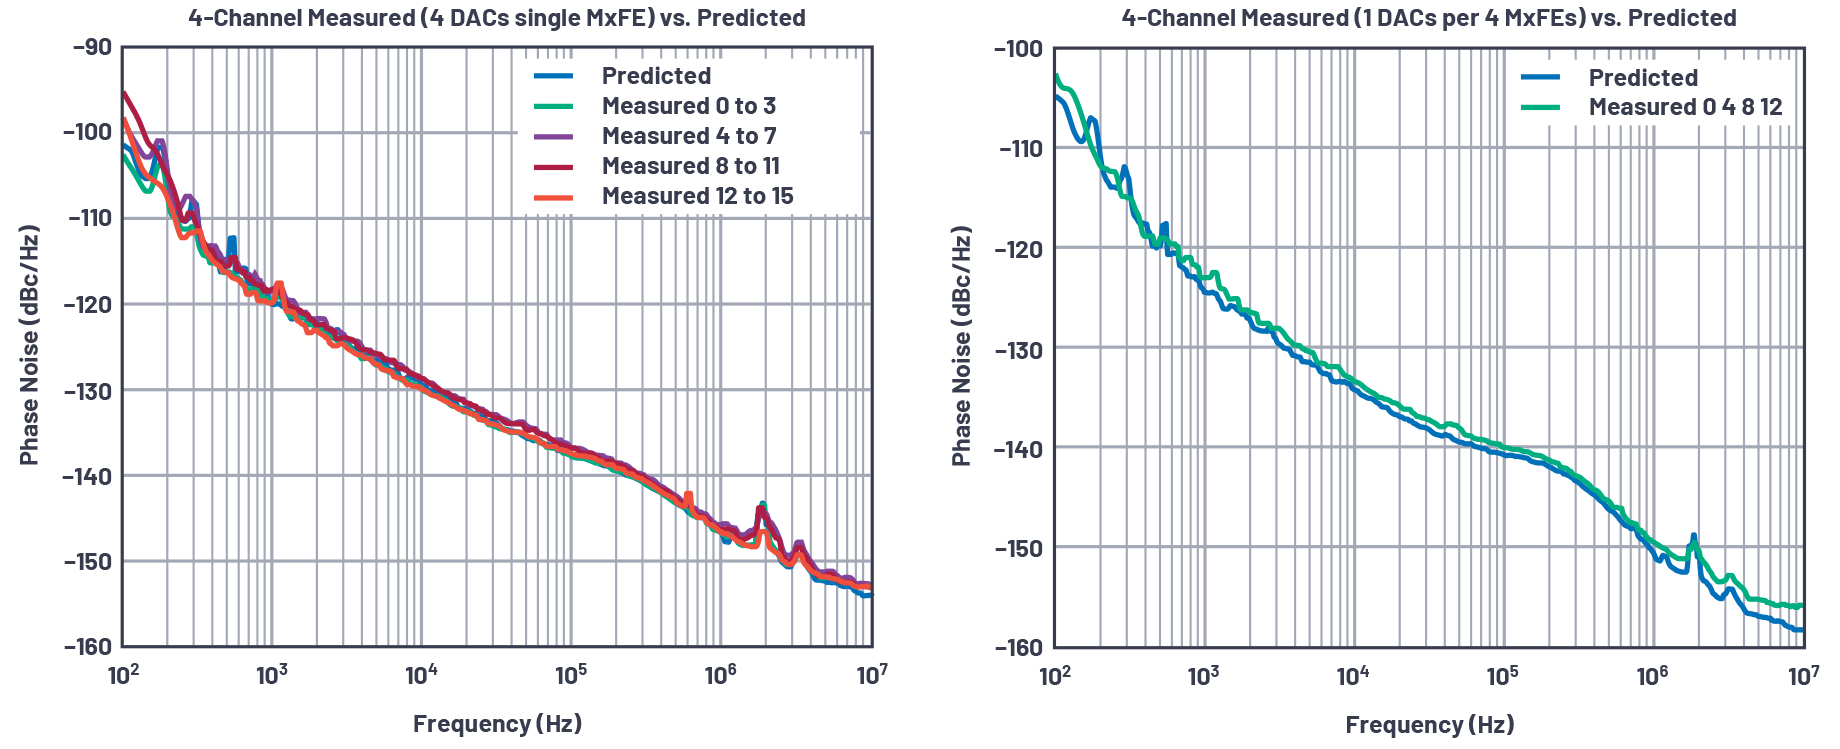
Figure 8. Measurement vs. model predictions for four channels at 3.2 GHz. The difference in the two plots is how transmit channels are shared across MxFEs.
Some observations on the measurements vs. predictions are worth noting. In many cases, the prediction is nearly identical to the measurements. There are some cases the measurement is slightly degraded from the prediction. We acknowledge this point here, but without an exact description. The left graph in Figure 8 provides a potential indicator. When zoomed in on these plots, we noticed the prediction matched two measured cases, and two measured cases were slightly higher. It is possible that the correlated noise per MxFE is not identical across the AD9081 ICs, leading to some of the discrepancy. Some of the simplified assumptions described in section V may be a contributor. In either case, the prediction is remarkably accurate, and we feel the approach is validated for this particular design.
Measurement Case 2: Distributed PLLs per MxFE
For this measurement, a separate ADF4371 was used for each of the four MxFEs as shown in Figure 1. The ADF4371 was phase-locked to a low phase noise 500 MHz reference and programmed for a 12 GHz output. Figure 9 shows the measurements and noise contributors used to inform the model.


Figure 9. a) Measurements made to inform the phase noise model when using separate ADF4371 chips as the clock input source, and b) calculated phase noise contributors to use in the model. This is for the case of distributed PLLs per MxFE.
For this case, the PLL is the dominant noise source and the MxFE noise contributors are well below the clock noise. Combined noise improves based on the number of PLLs used in the distributed system, as shown in Figure 10.

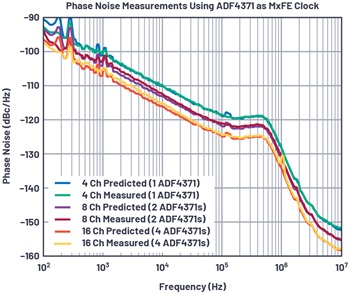
Figure 10. Measurement vs. modeled predictions at 3.2 GHz after combining various phase-aligned transmit channels when using the ADF4371 as a clock source for each MxFE.
Conclusion
This article has shown an empirical model that quite accurately predicts the phase noise of combined channels. The premise of the approach is to first view the system from a noise source perspective and redraw block diagrams to easily see terms that are correlated and those that are uncorrelated.
We also emphasize the word “empirical,” which means that the proposed method is verifiable by observation or experience rather than theory or pure logic. For the case of phase noise, the view is that some measurements and observations are needed to assess trends and contributors. Once these are understood, the system noise can be calculated systematically.
The data and equations used in this article are somewhat specific to the hardware and based on the previously described observations. The approach, however, can be extended to any multichannel system. A more generalized block diagram is shown in Figure 11. By starting with the system reference oscillator, and then drawing out the clock and LO distribution along with the channel level hardware, it becomes more straightforward to visualize noise contributors in a large system.

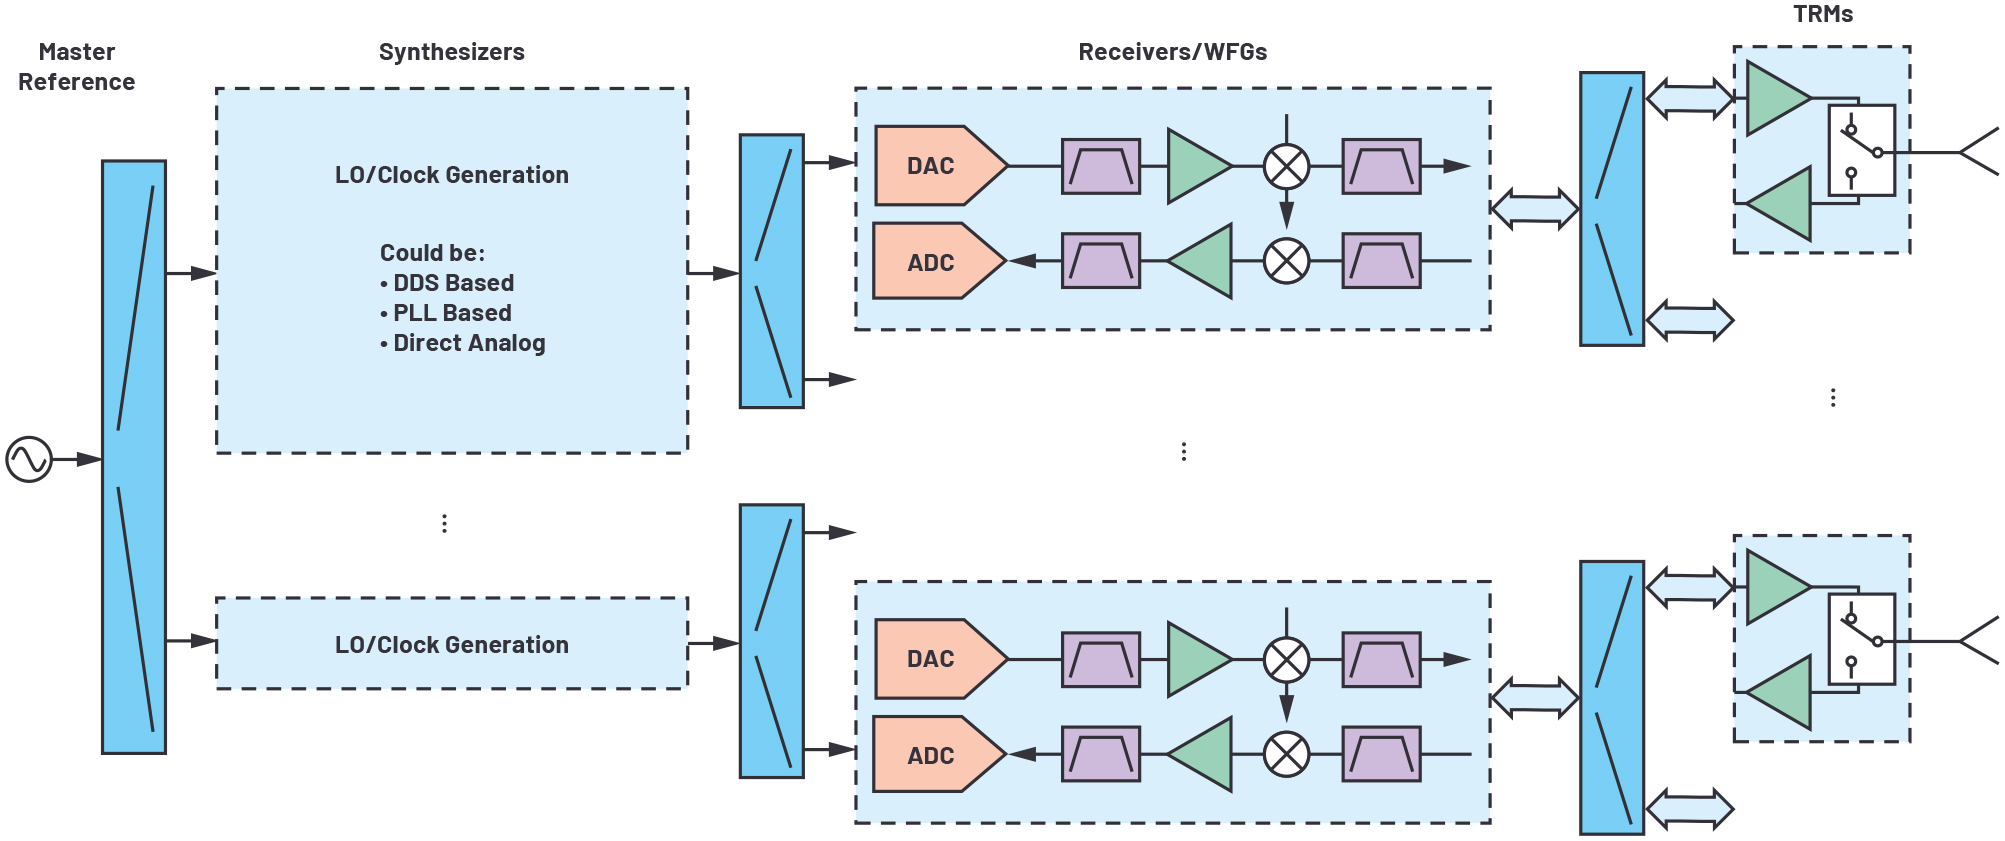
Figure 11. Generalized phased array diagram from a phase noise point of view. Every signal contains noise terms that are a combination of noise components distributed across the array. By redrawing a system from this perspective, it can be easier to visualize the tracking of correlated vs. uncorrelated noise at a system level. If designers start with the system reference oscillator and draw out the clock and LO distribution along with the channel-level hardware, it can be more straightforward to visualize noise contributors in a large system.
About the Authors
Peter Delos is a technical lead in the Aerospace and Defense Group at Analog Devices in Greensboro, North Carolina. He received his B.S.E.E. degree from Virginia Tech in 1990 and M.S.E.E. degree from NJIT in 2004. Peter ha...
Mike Jones is a principal electrical design engineer in Analog Devices working in the Aerospace and Defense Business Unit in Greensboro, North Carolina. He joined ADI in 2016. From 2007 until 2016, he worked at General Ele...
Related to this Article
Industry Solutions
Technology Solutions
Resources