CN0510


Overview
Design Resources
Design & Integration File
- Schematic
- Bill of Materials
- Gerber Files
- Allegro Files
- Assembly Drawing
Evaluation Hardware
Part Numbers with "Z" indicate RoHS Compliance. Boards checked are needed to evaluate this circuit.
- EVAL-AD5941BATZ ($176.55) Electrochemical Impedance Spectroscopy Board
- EVAL-ADICUP3029 ($52.97) Ultralow Power Arduino From Factor Development Board
Device Drivers
Software such as C code and/or FPGA code, used to communicate with component's digital interface.
Features & Benefits
- Designed for Lithium Ion Battery Testing
- Milli-hertz to Kilo-hertz frequency sweep
- Arduino Shield Compatible
Product Categories
Markets and Technologies
Parts Used
Documentation & Resources
-
CN0510 User Guide9/26/2019WIKI
-
Solutions For Rapid Prototyping: Answering the Needs of Practicing Engineers8/23/2023PDF784 K
-
CN0510: Electrochemical Impedance Spectroscopy (EIS) for Batteries (Rev. A)9/27/2019PDF419 K
Circuit Function & Benefits
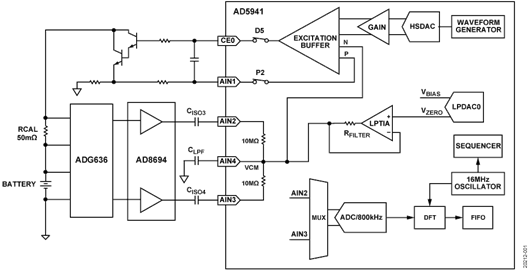
The circuit shown in Figure 1 is an electrochemical impedance spectroscopy (EIS) measurement system for characterizing lithium ion (Li-Ion) and other types of batteries. EIS is a safe perturbation technique used to examine processes occurring inside electrochemical systems. The system measures the impedance of a battery cell over a range of frequencies. The data can determine the state of health (SOH) and state of charge (SOC) of a battery. Using an ultralow power analog front end (AFE), this system is designed to excite and measure current, voltage, or impedance response of a battery.
Aging leads to performance degradation and irreversible changes in battery chemistry. Impedance increases linearly with the decline in capacity. Monitoring the increase in impedance of a battery using EIS can determine the SOH and whether the battery needs replacing, reducing both system downtime and maintenance costs.
Batteries require a current excitation, not voltage, and the impedance values are small, in the milliohm range. This system includes the necessary circuitry to inject a current into the battery and allows for calibration and sensing of the small impedances found in batteries.

Circuit Description
Battery EIS Theory
Batteries are nonlinear systems; therefore, a small sample of the I-V curve of the cell is examined for the system to behave pseudo linearly. In a pseudo linear system, a sinusoidal input produces a sinusoidal output at the exact same frequency but with shifted phase and amplitude. In EIS, an ac excitation signal is applied to the battery to obtain the data.
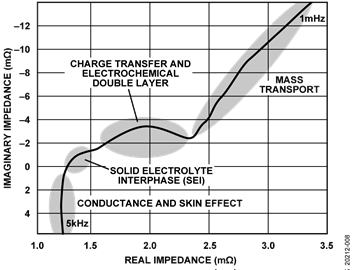
Information from EIS is most frequently represented by a Nyquist plot, but can also be shown using a Bode plot (this circuit note focuses on the most common format). In a Nyquist plot, the negative imaginary component of impedance (y-axis) is plotted against the real component of impedance (x-axis). Different regions of the Nyquist plot correspond to various chemical and physical processes occurring in the battery (see Figure 2).

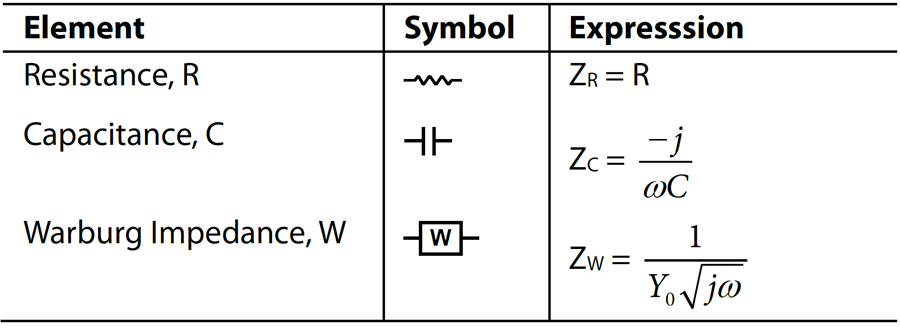
These processes are modelled using resistors, capacitors, and a component called the Warburg resistance represented by the letter, W, (described in more detail in the Equivalent Circuit Models (ECM) section). There is no simple electronic component to represent Warburg diffusion resistance.
Equivalent Circuit Models (ECM)
Equivalent circuit models (ECM) use simple electronic circuits (resistors and capacitors) to mimic electrochemical processes. The model uses a simple circuit to represent a complex process to aid analysis and simplify calculations. These models are based on data collected from the battery under test. After the Nyquist plot of the battery is characterized, an ECM can be developed. Most commercial EIS software includes an option to create a specific and unique equivalent circuit model to more closely approximate the shape of the Nyquist plot produced by any particular battery. There are four common parameters that represent battery chemistry when creating a model for a battery.
Electrolytic (Ohmic) Resistance—RS
The characteristics of RS are as follows:
- Corresponds to the resistance of the electrolyte in the battery
- Affected by the electrodes and wire length used when performing the test
- Increases as the battery ages
- Dominant when the frequency is >1 kHz
Double Layer Capacitance—CDL
CDL characteristics are as follows:
- Occurs between the electrode and the electrolyte
- Composed of two parallel layers of opposite charges encompassing the electrode
- Dominant in the 1 Hz to 1 kHz frequency range
Charge Transfer Resistance—RCT
- Resistance occurs from transferring electrons from one phase to another, that is, a solid (electrode) to a liquid (electrolyte)
- Changes with temperature and state-of-charge of the battery
- Dominant in the 1 Hz to 1 kHz frequency range
Warburg (Diffusion) Resistance—W
- Represents a resistance to mass transfer, that is, diffusion control
- Typically exhibits a 45° phase shift
- Dominant when the frequency is <1 Hz
Table 1 provides the symbols and expressions for each ECM component.
Building the Battery ECM
Developing an equivalent circuit model (ECM) is often an empirical process, requiring experimentation with various equivalent circuit models until the model matches the measured Nyquist plot.
The following sections cover how to create a typical battery model.
Randel Circuit Model Ohmic and Charge Transfer Effect
The Randel circuit is the most common ECM. The Randel circuit includes an electrolyte resistance (RS), a double layer capacitor (CDL), and a charge transfer resistance (RCT). The double-layer capacitance is in parallel with the charge-transfer resistance, which creates a semicircle simulation shape.
In addition to being a useful basic model, the simplified Randel circuit is the starting point for other more complex models.


The Nyquist plot for a simplified Randel circuit is always a semicircle. The electrolyte resistance (RS) is determined by reading the real axis value at the high frequency intercept point of the battery characterization, that is, where the line crosses the x-axis on the left side of the plot, which is the high frequency zone. In Figure 4, the electrolyte resistance (RS) is the intercept point near the origin of the Nyquist plot, which is 30 Ω. The real axis value at the other (low frequency) intercept point is the sum of the charge transfer resistance (RCT) and the electrolyte resistance (in this case 270 Ω). The diameter of the semicircle is therefore equal to the charge-transfer resistance (RCT).
Warburg Circuit Model—Diffusion Effect
When Warburg resistance is modeled, the component, W, is added in series with RCT (see Figure 5). The addition of Warburg resistance produces the 45° line, evident in the low frequency region of the plot.


Combined Randel and Warburg Circuit Model
Some batteries depict two semicircles. The first semicircle corresponds to the solid electrolyte interface (SEI). SEI growth results from irreversible electrochemical decomposition of the electrolyte. In the case of Li-Ion batteries, SEI forms at the negative electrode as the battery ages. The product of this decomposition forms a solid layer on the surface of the electrode.
After an initial SEI layer has formed, the inability of electrolyte molecules to travel through the SEI to the active material surface where they could react with lithium ions and electrons, suppresses further SEI growth.
Two Randel circuits are combined to model for this type of Nyquist plot. The resistor (RSEI) models the resistance of the SEI.


Battery Impedance Solution Using AD5941
The AD5941 impedance and electrochemical front end is the core of the EIS measurement system. The AD5941 consists of a low bandwidth loop, a high bandwidth loop, a high precision analog-to-digital converter (ADC), and a programmable switch matrix.
The low bandwidth loop consists of a low power, dual output, digital-to-analog converter (DAC) that generates VZERO and VBIAS, and a low power transimpedance amplifier (TIA) to convert input currents to voltage.
The low bandwidth loop is for low bandwidth signals where the frequency of the excitation signal is sub 200 Hz, such as battery impedance measurements.
The high bandwidth loop is for EIS measurements. The high bandwidth loop consists of a high speed DAC designed to generate an ac excitation signal when making impedance measurements. The high bandwidth loop has a high speed TIA designed to convert high bandwidth current signals up to 200 kHz into voltages to be measured by the ADC.
The switch matrix is a series of programmable switches that allows the connection of external pins to the high speed DAC excitation amplifier and to the high speed TIA inverting input. The switch matrix provides an interface to connect an external calibration resistor to the measurement system. The switch matrix also provides flexibility for connecting electrodes.
Batteries typically have impedances in the range of milliohms and require a calibration resistor, RCAL, of similar value. The 50 mΩ RCAL in this circuit is excessively small for the AD5941 to measure directly. Because of the small RCAL, there is an external gain stage using the AD8694 to amplify the receive signal. The AD8694 has ultralow noise performance and low bias and leakage current parameters, which are critical for EIS applications. In addition, sharing the same amplifier across RCAL and the actual battery can help compensate errors coming from cables, ac coupling capacitors, and the amplifier.
Excitation Signal
The AD5941 uses its waveform generator, high speed DAC, (HSDAC) and excitation amplifier to generate sine wave excitation signals. The frequency is programmable from 0.015 Hz up to 200 kHz. The signal is applied to the battery through the CE0 pin and the external Darlington pair transistor configuration, as shown in Figure 9. The current amplifier is required because the maximum current the excitation buffer can source is 3 mA. A typical battery requires up to 50 mA.

Measuring Voltage
There are two voltage measuring stages. First, the voltage drop across the RCAL is measured. Next, the voltage across the battery is measured. The voltage drop across each component is very small in the range of microvolts (μV). Thus, the measured voltage is sent through an external gain stage. The outputs of the gain amplifiers, AD8694, are sent directly to the ADC on the AD5941 chip at Pin AIN2 and Pin AIN3. Using the discrete Fourier transform (DFT) hardware accelerator, a DFT is performed on the ADC data where the real and imaginary numbers are calculated and stored in the data FIFO for both the RCAL voltage measurement and the battery voltage. The ADG636 multiplexes the battery and RCAL to the AD8694 gain stage.
The ultralow charge injection and small leakage currents of the ADG636 switch are needed to negate any parasitic capacitance on the input pins of the AD5941. Because the AIN2 and AIN3 pins are for both RCAL measurements and battery measurements, the signal path for the impedance measurement is ratiometric.
Calculating Unknown Impedance (ZUNKNOWN)
EIS measurements are ratiometric. To measure an unknown impedance (ZUNKNOWN), an ac current signal is applied across the known resistor, RCAL, and the response voltage, VRCAL, is measured. Next, the same signal is applied across the unknown impedance, ZUNKNOWN, and the response voltage, VZUNKNOWN, is measured. A discrete Fourier transform is performed on the response voltages to determine the real and imaginary values of each measurement. The unknown impedance can be calculated using the following equation:


Circuit Evaluation & Test
The following section outlines testing procedures and the gathering of the results for the CN-0510 circuit design. For complete detail on the hardware and software setup, visit the CN-0510 User Guide.
Equipment Needed
- PC with a USB port and Windows® 7 or higher.
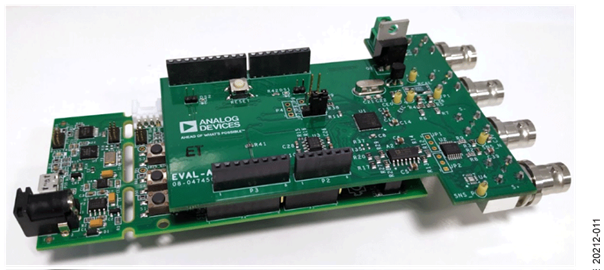
- EVAL-AD5941BATZ circuit board.
- EVAL-ADICUP3029 development board.
- CN-0510 reference software
- USB Type A to micro USB cable
- Bayonet Neill–Concelman (BNC) connector to grabber/alligator clips
- Battery (device under test, DUT)

Getting Started
1. Connect the EVAL-AD5941BATZ to the EVAL-ADICUP3029 via the Arduino headers.
2. Plug in BNC to grabber cables on F+, F−, S+, S−.
3. Power the boards by connecting the micro USB cable into P10 on the EVAL-ADICUP3029 and plug the other end of the USB cable to your computer.
a. Ensure the boards are powered before connecting the battery to avoid a short circuit.
4. Download the example firmware from GitHub. Instructions to download are provided at the analog.com wiki site.
5. Configure the embedded software for the parameters that are needed for your application.
a. Use the AD5940BATStructInit(void) function. (Example follows.)

b. Build and download the code onto the EVAL-ADICUP3029 target board using the recommended Interactive development environment (IDE). Refer to the AD5940
user guide for details on installation.
6. Connect the battery as shown in Figure 13. Connect F+ and S+ leads to the positive terminal of the battery, and connect S− and F− to the negative terminal of the battery.
7. Press the 3029-RESET button on the EVAL-ADICUP3029.

Battery Test and Results
1. Open a serial terminal using a program such as RealTerm.
2. Configure the baud rate to 230,400.
a. Select the COM port that the EVAL-ADICUP3029 is connected to.
3. The measurement results are streamed over UART and can be saved to a file for analysis.
Note, the calibration function is executed once at the beginning of the program. If the excitation frequency is slow, it takes some time for at least four periods of the waveform to be captured. For a 0.1 Hz measurement it takes more than 40 seconds to complete.
Note, the hardware is optimized for frequencies above 1 Hz. Measurements below this value are noisier due to the 1/f noise of the external amplifiers.
Figure 14. Results Displayed in a Terminal Program
Figure 15 shows the Nyquist plot obtained for an example Li-Ion battery measured using the EVAL-AD5941BATZ.

For more information on hardware and software setup, visit the CN-0510 User Guide for complete details.