CN0428

Overview
Design Resources
Design & Integration File
- Schematic
- Bill of Materials
- Gerber Files
- Allegro Files
- Assembly Drawing
Evaluation Hardware
Part Numbers with "Z" indicate RoHS Compliance. Boards checked are needed to evaluate this circuit.
- EVAL-ADICUP3029 ($52.97) Ultra Low Power Arduino form factor compatible Development Platform
- EVAL-CN0428-EBZ ($58.85) Water Quality Sensor pH or Conductivity
- EVAL-M355-ARDZ-INT ($58.85) ADuCM355 based Sensor Interposer Board
Features & Benefits
- Measure from 1 up to 4 sensor channels
- Selectable SPI, I2C, or UART communication
- 10-Pin JTAG/SWD connector for easy programming
- Form Factor Compatible with Arduino
Markets and Technologies
Parts Used
Documentation & Resources
-
CN0428 User Guide11/9/2018WIKI
-
Solutions For Rapid Prototyping: Answering the Needs of Practicing Engineers8/23/2023PDF784 K
-
CN0428: Water Quality Measurement System11/13/2018PDF332 K
-
Liquid Measurements—From Water to Blood10/1/2019
Circuit Function & Benefits
Many important liquid analyses like pH rely on electrochemistry, a branch of chemistry that characterizes the behavior of reduction-oxidation (redox) reactions by measuring the transfer of electrons from one reactant to another. Electrochemical techniques can be used directly or indirectly to detect several important parameters that affect water quality, including chemical indicators, biological and bacteriological indicators and even some low level contaminants like heavy metals. Many of these indicative measurements are pertinent to determining important quality parameters of the tested analyte.
The circuit shown in Figure 1 is a modular sensing platform that allows the user to design a flexible electrochemical water quality measurement solution. Its high level of integration enables an electrochemical measurement platform applicable to a variety of water quality probes including pH, oxidation reduction potential (ORP), and conductivity cells.
The system allows up to four probes to be connected at one time for different water quality measurements.

Circuit Description
Fundamentals of pH Measurements
The pH value is a measure of the relative amount of hydrogen and hydroxide ions in an aqueous solution. In terms of molar concentrations, water at 25°C contains 1 × 10⁻⁷ moles/liter of hydrogen ions and the same concentration of hydroxide ions. A neutral solution is one in which the hydrogen ion concentration exactly equals the hydroxide ion concentration. pH is another way of expressing the hydrogen ion concentration and is defined as follows:
Therefore, if the hydrogen ion concentration is 1.0 × 10⁻² moles/liter, the pH is 2.00.
The pH electrodes are electrochemical sensors used by many industries but are of particular importance to the water and wastewater industry. The pH probe consists of a glass measuring electrode and a reference electrode, which is analogous to a battery. When the probe is placed in a solution, the measuring electrode generates a voltage depending on the hydrogen activity of the solution, which is compared to the potential of the reference electrode. As the solution becomes more acidic (lower pH), the potential of the glass electrode becomes more positive (+mV) in comparison to the reference electrode. And as the solution becomes more alkaline (higher pH), the potential of the glass electrode becomes more negative (−mV) in comparison to the reference electrode. The difference between these two electrodes is the measured potential. A typical pH probe ideally produces ±59.154 mV/pH units at 25°C. This is expressed in the Nernst equation as follows:
where:
E is the voltage of the hydrogen electrode with unknown activity.
a = ±30 mV, zero point tolerance.
T is the ambient temperature in °C.
n = 1 at 25°C, valence (number of charges on ion).
F = 96485 coulombs/mol, Faraday constant.
R = 8.314 volt-coulombs/°K mol, ideal gas constant.
pH is the hydrogen ion concentration of an unknown solution.
pHISO is the reference hydrogen ion concentration. Consult the
probe documentation. Typical pHISO = 7.
The equation shows that the voltage generated is dependent on the acidity or alkalinity of the solution and varies with the hydrogen ion activity in a known manner. The change in temperature of the solution changes the activity of its hydrogen ions. When the solution is heated, the hydrogen ions move faster, which results in an increase in potential difference across the two electrodes. Conversely, hydrogen activity decreases when the solution is cooled. Ideally electrodes with a pHISO of 7 are designed to produce a zero volt potential when placed in a buffer solution with a pH of 7.

Temperature Compensation in pH Measurement
One of the most important parameters to be considered when measuring the pH of a solution is the temperature variation. When the temperature of a solution changes, the pH value of the solution also changes by a considerable value. This changed value is not considered an error in the pH reading; it is the true pH value of the solution at the new temperature.
Changes in temperature can cause a change in the sensitivity of the measuring electrode, which in turn causes a measurement error. This error is predictable and can be accounted for by calibrating the probe over temperature and correcting for temperature during subsequent measurements.
A perfect electrode is an electrode that is accurately zeroed at pH 7. The effect of temperature is negligible on the sensitivity of the electrode at pH 7. However, most of the pH electrodes are not perfect electrodes and have electrode sensitivity issues due to temperature variations. The general temperature error is very close to 0.003 pH/°C/pH units away from pH 7. In such cases, it is important to calibrate the pH meter to apply this correction factor of 0.003.
This compensation can be achieved by having a temperature sensor calibrated well with a pH sensor. This temperature sensor is then able to tell the change in temperature, if any. If there is a change present, the correction factor reading of 0.003 pH/°C/pH units away from pH 7 is fed to the final pH reading, and the meter then shows a corrected and more accurate reading. This mechanism works well to compensate for any error in pH that can arise due to temperature variations.
pH Calibration
The characteristics of a pH electrode change with time due to electrode coating and aging. Therefore, a calibration procedure is required to obtain maximum accuracy.
Calibration is performed by measuring the pH of two buffer solutions, each with a known pH. The software includes NIST lookup tables for different pH buffer solutions and includes the pH temperature corrected pH values from 0°C to 95°C. The resistance temperature detector (RTD) is used to measure the temperature of the solution. Using the following linear equation,
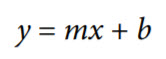
The actual slope of the pH sensor transfer function is determined, and the actual offset voltage measured. To calculate the slope, solve the following equation:
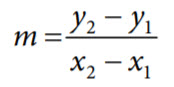
where:
y1 is the measured voltage at first point.
y2 is the measured voltage at second point.
x1 is the known pH at first point.
x2 is the known pH at second point.
After taking the above measurements and substituting one of the calibration points into Equation 2, the unknown pH can be determined from the following final equation:
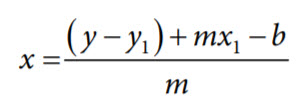
where:
x is the unknown pH.
y is the measured voltage.
b is the measured offset voltage.
m is the slope.
Equation 3 can then be used to adjust values given by the Nernst equation described previously.
More information available in the CN-0428 User Guide.
Fundamentals of Conductivity Measurements
Conductivity is the measure of how well a substance conducts electric current. The extent to which a substance allows the flow of electric current is a measure of its conductivity. Electrical conductivity in metals and semiconductors take place with the movement of electrically charged particles. The valence electrons present in the outer shell of an atom move around in the presence of an externally applied potential difference, thus causing the flow of electrons, which produces electric current.
Pure water has very low conductivity due to a small amount of dissociation of the H2O into a H+ ion and an OH− ion, but water encountered in most everyday situations contains significant ionic materials that increase the conductivity. Tap water, distilled water, surface water, water used in industrial plants, among others have different ionic components present in them. Measuring of conductivity in a solution therefore involves measurement of the behavior of these ionic bodies that are present within the solution.
The ionic components present in the solution have positive and negative charges associated with them. When a potential difference is applied in such solutions through external electrodes, cathode and anode, there is a flow of current that arises due to the movement of cations and anions between these electrodes. The measure of flow of ions that give rise to current is the measure of conductivity of that solution.
Conductivity is largely dependent on various factors of a solution that include mobility, valence, concentration of the ions as well as the temperature of the solution. Also, conductivity is highly dependent on the purity of the solution. For example, a water sample that is ultrapure does not contain many ionic components and therefore has low conductivity, approximately 5 μS/cm. Whereas a water sample with metal salts and ionic compounds contains many cations and anions to conduct electricity, therefore giving a large value of conductivity. Salt water can be roughly 5 S/cm. This variance makes conductivity a wide dynamic range measurement to take.
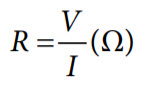
As in case of metals and semiconductors, the conductivity in solutions is governed by Ohm’s law. When a potential difference (V) is applied between the two electrodes, there occurs a flow of electric current (I) between the electrodes with the movement of cations and anions.
This voltage, V, is directly proportional to the current, I: V α I.

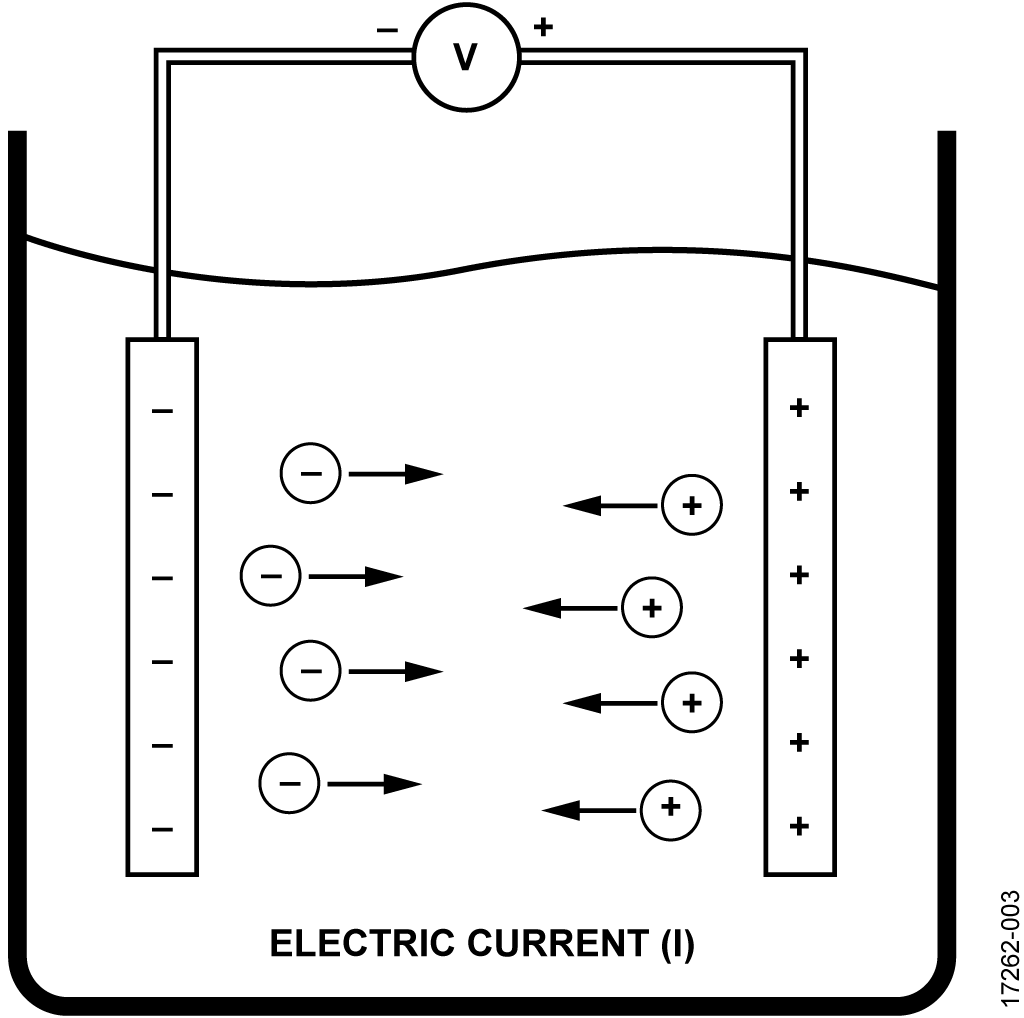
The proportionality constant is nothing but the resistance of the solution (R), and can be calculated using Ohm’s law as shown in the following equation. The resistance unit is ohms (Ω).
where:
V is the voltage in volts (V).
I is the current in amps (A).
R is the resistance of the solution in ohms (Ω).
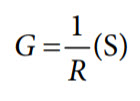
The reciprocal of resistance is known as conductance (G). It is measured in Siemens (S), which equals Ω−1.
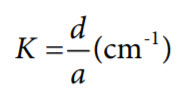
Another important parameter in electrochemistry is cell constant (K), which is the ratio of the distance (d) between the electrodes to the area (a) of the electrodes.
where:
K is the cell constant (cm−1).
a is the effective area of the electrodes (cm2).
d is the distance between the electrodes (cm).
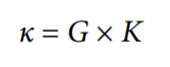
Summarizing the previous calculations, conductivity is the ability of the solution to conduct electric current and is a product of conductance and cell constant. The conductivity (κ) is defined as follows:
where:
G = conductance (S)
K = cell constant (cm−1)
Because the cell constant, K, is expressed in (cm−1), the conductivity (ρ) is typically expressed in S/cm, with most environmental water falling in a range of mS/cm or μS/cm.

Fundamentals of ORP Measurements
Oxidation-reduction potential (ORP) is an electrochemical measurement of the tendency of a substance to gain electrons (oxidize) or lose electrons (reduce). It is the characteristic of a solution to either oxidize or reduce another chemical substance, measured in millivolts. ORP is dependent on the relative amount and strength of oxidizing agents to reducing agents, in a solution that contains both. The terms ORP and redox sensor are both commonly used and are interchangeable. The actual measurement is similar to that of the pH measurement. Whereas pH indicates acid/base levels by measuring hydrogen ion activity, a redox measurement indicates oxidizing/reducing capability of a solution by measuring the electron activity. An ORP reading that produces a positive result always indicates an environment supportive of oxidation. On the other hand, a negative value of ORP indicates a reduction environment. ORP whether a particular reaction can be expected to occur or not. Along with ORP, knowing the various other parameters in a solution such as pH, temperature, and impurities in the solution makes it possible to conduct a detailed analysis of the reaction that is expected to occur.
Though the measurement of ORP is similar to that of pH, the correct selection of electrodes is the differentiating parameter. It is important to have electrodes that have low resistance. Inert metal electrodes such as platinum or gold are the electrodes that are usually preferred.
During the process of electrolysis, these low resistance electrodes either gives up electrons to an oxidant or keeps accepting electrons from a reductant until equilibrium is achieved. A stable state is achieved due to the potential buildup of a charge on the electrode, which produces a voltage that is the ORP of the solution.
The oxidation reduction potential of a solution is partially a function of temperature, which is reflected in the Nernst equation.
ORP electrodes measure the redox potential according to the Nernst half-cell potential equation as follows:
where:
E is the electrode potential measured
E0 is a voltage specific to the system under analysis. Values of E0 are available in chemical handbooks for a particular reaction.
T is the absolute temperature (K).
n is the the number of electrons involved in the equilibrium between the oxidized and reduced species.
F = 96,485 coulombs/mol, Faraday constant.
R = 8.314 volt-coulombs/°K mol, ideal gas constant.
Aox is the activity of the oxidant.
ARed is the activity of the reductant.
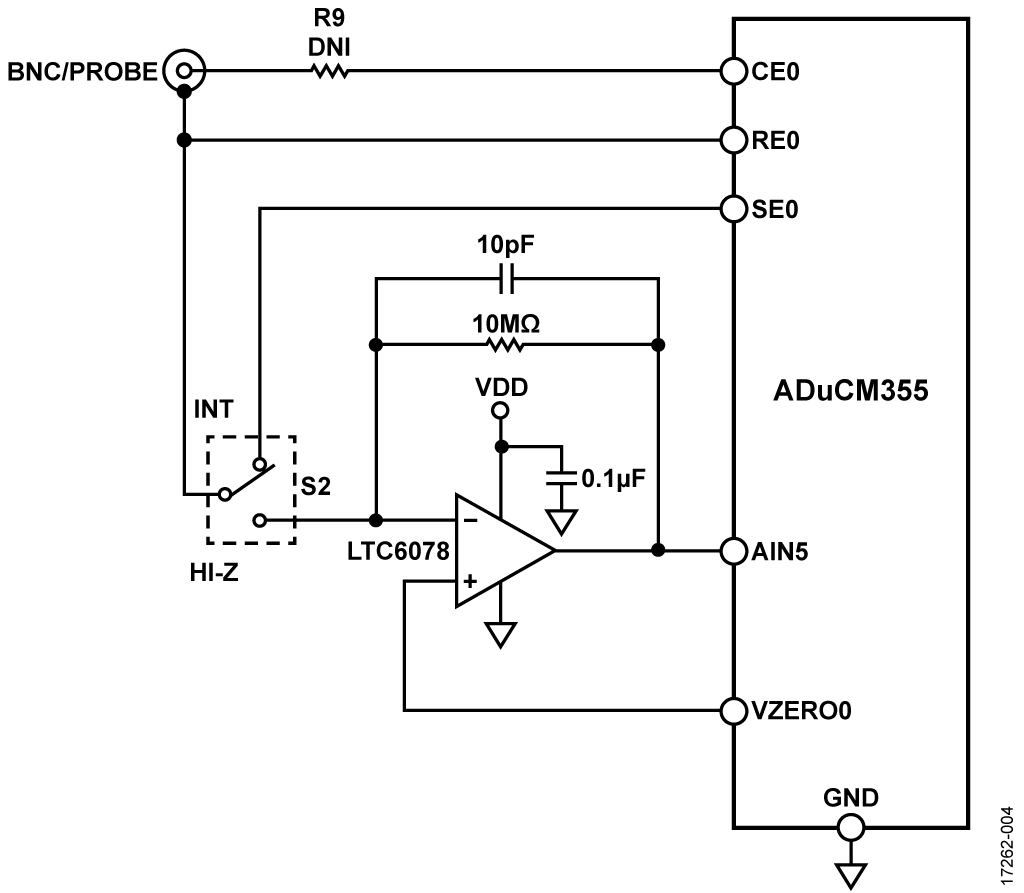
Electrochemical Analog Front End
The ADuCM355 provides a platform solution for electrochemical measurements with all the necessary measurement functions integrated along with a low power microprocessor (MCU). Apart from the primary measurement and electrochemical capabilities, customized and flexible measurements can also be performed using the arbitrary measurement functions. This enables a complete measurement platform in a small form factor with very low power for solution reuse across multiple sensing parameters, implementable inside the sensor housing with the capability and performance of a benchtop instrument. The ADuCM355’s high degree of integration reduces device count, improves reliability, and provides more consistent performance than discretely implemented solutions.
Micropower Precision Amplifier
The LTC6078 has the ability to provide a precision buffer for high impedance sensors like pH probes. Its precision performance and low bias current (1 pA maximum input bias current) are key factors in this design where impedance of pH probes can be several gigaohms (GΩ).
The LTC6078’s low 1/f noise factor, 1 μV p-p, is another important characteristic for measurement accuracy in a low update rate sensing system. The LTC6078 maintains precision performance with low supply voltages, has high input impedance and wide gain bandwidth, operating on ultra low power consumption (54 μA) with a shutdown feature available.
Application Modes
The EVAL-CN0428-EBZ board allows both pH and impedance measurements modes along with temperature compensation depending on the configuration of the EVAL-CN0428-EBZ board switches and jumper. Table 1 shows the various switch configurations for each measurement.
Switch S1 has two settings to allow the user to select between the pH and Z settings, as labeled on the printed circuit board (PCB). The user can measure voltage with the high impedance LTC6078 buffer (using the pH setting), or use the ADuCM355 potentiostat to measure impedance or conductivity (using the Z setting).
Switch S2 chooses the impedance measurement range using the internal ADuCM355 resistors (INT) or the 10 MΩ transimpedance amplifier (TIA) range provided by the LTC6078. Internal resistors in the ADuCM355 go up to 128 kΩ for the high power TIA (HPTIA) and 512 kΩ for the low power TIA (LPTIA). The EVAL-CN0428-EBZ also includes a 1 MΩ resistor external to the ADuCM355 used for lower current range during impedance measurements.
| Desired Measurement | S1 Setting | S2 Setting |
| pH | pH | Not applicable |
| Conductivity or impedance with autoranging from 100 Ω to 10 MΩ | Z | INT selects the internal ADuCM355 resistors with autoranging |
| Low current conductivity or impedance greater than 200 kΩ | Z | HI-Z selects the 10MΩ LTC6078 low current TIA range |
pH Mode Considerations
Switch S1 must be set to pH for the user to measure voltage with the high impedance LTC6078 buffer. Use pH mode for any voltage output sensors, including pH, ORP, or other potentiometric sensors like ion selective electrodes.
Impedance Mode Considerations
Switch S1 must be set to Z to set the EVAL-CN0428-EBZ into impedance mode. Impedance mode is used for conductivity sensors, electrochemical impedance spectroscopy sweeps, or any other resistance or current-based measurements.
With S2 in INT mode (using the internal ADuCM355 TIA ranges and autoranging), the user can measure impedance from <100 Ω to approximately 10 MΩ.
When measuring impedance or conductivity, the measurement firmware on the ADuCM355 automatically adjusts the TIA and the gain of the programmable gain amplifier (PGA) to maximize the input signal without saturating the analog-to-digital converter (ADC). This greatly increases the dynamic range of the measurement so that wide ranges of conductivity can be measured as well as the impedance of both low resistance sensors like ORP and high-resistance sensors like pH probes. This does require multiple external calibration resistors to improve accuracy over such a wide range. These extra calibration resistors are included in the design. If the circuit has to change ranges, the measurement time increases. This increase can be noticeable when measuring low frequencies.
With S2 in high-Z mode (using the external 10 MΩ range with the LTC6078), the user can measure from 200 kΩ to >100 MΩ. S2 is a mechanical switch to provide lower leakage, which also means that autoranging is not possible when in the 10 MΩ high impedance range. The maximum current that can be detected is approximately 100 nA. Therefore, impedances below 200 kΩ cannot be detected in this mode.
Sensor Connections
The BNC connector is for the main sensor measurement. This can be pH, ORP, or any 2-wire conductivity probe. Not all water quality probes are BNC based, but it is the most common connector for analog output probes.
The RCA connector is used for the temperature measurement. Frequently, temperature is integrated into the probe itself via an negative temperature coefficient (NTC) thermistor. The RTD temperature sensors such as PT100 and PT1000 are also common. RCA is one common interface, but there are also other interfaces, such as banana plugs.
Header P3 is available to measure the temperature inputs for cases when an RCA plug or RCA adapter are not available.
Common Variations
Four-electrode conductivity probes are not recommended for direct use with the EVAL-CN0428-EBZ. However, the ADuCM355 can accommodate these probes in general. If 4-electrode measurement is needed in an end system, refer to the M355_4WireImpedance example project in the ADuCM355 software library.
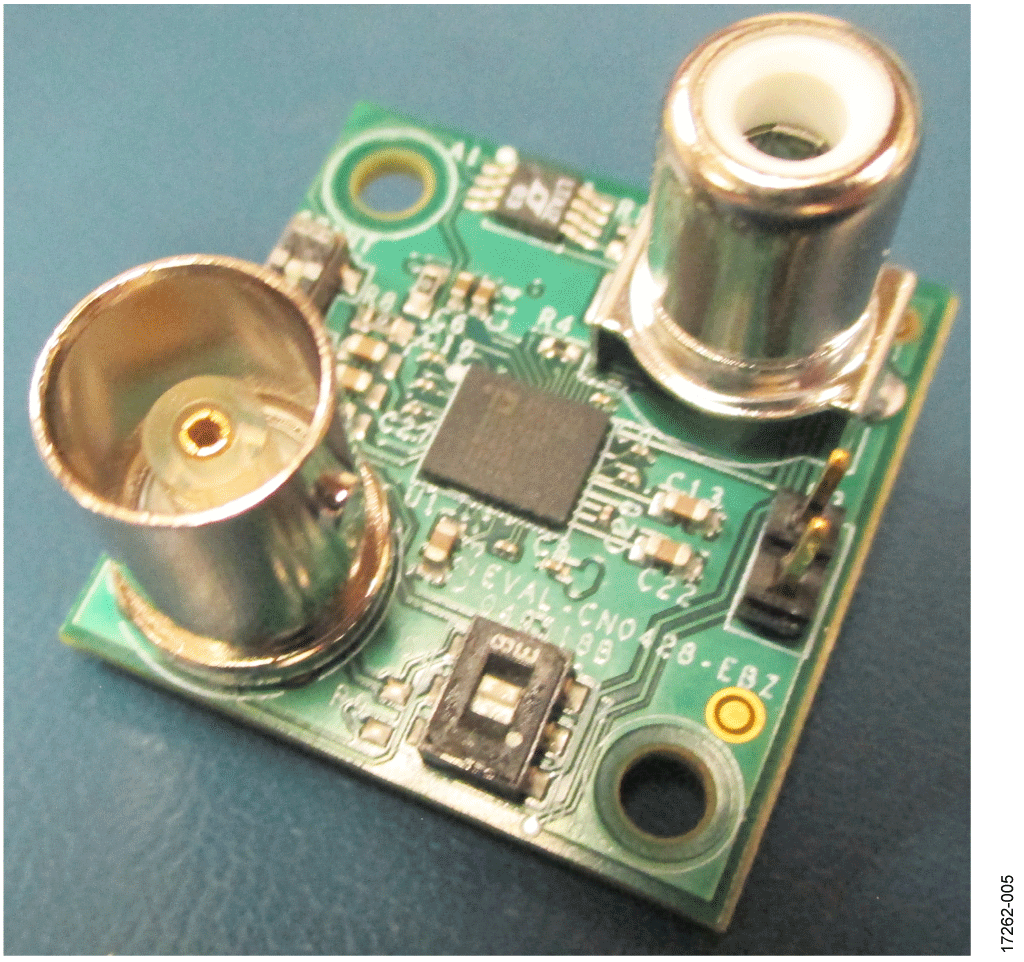
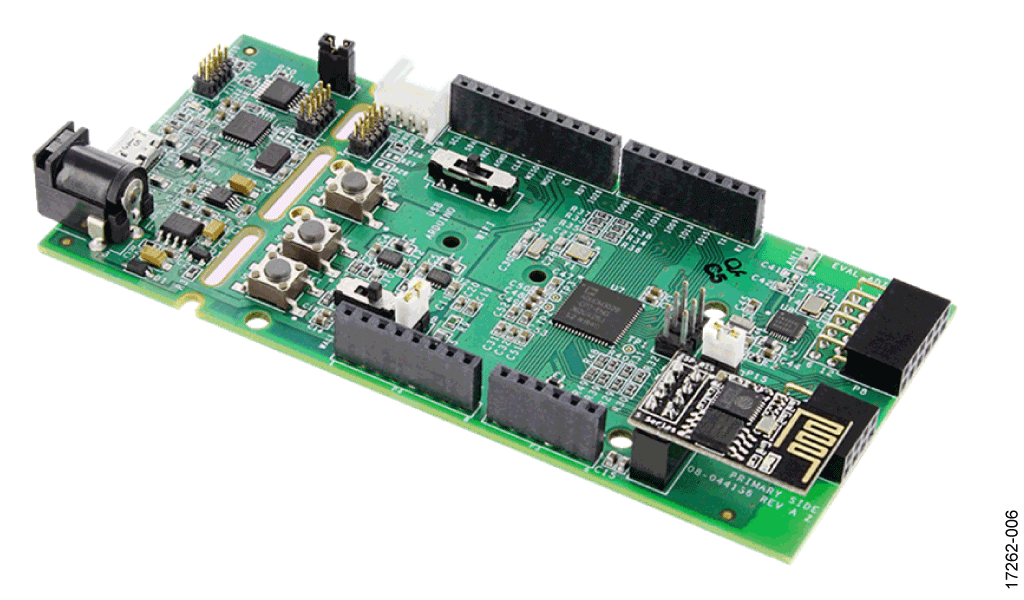
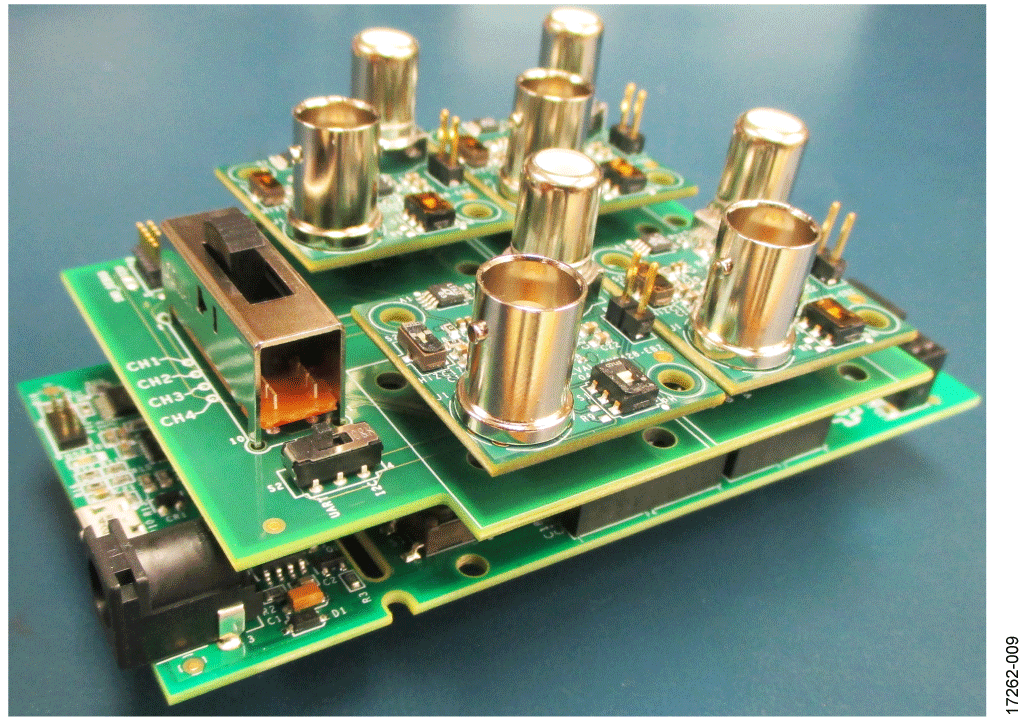
Circuit Evaluation & Test
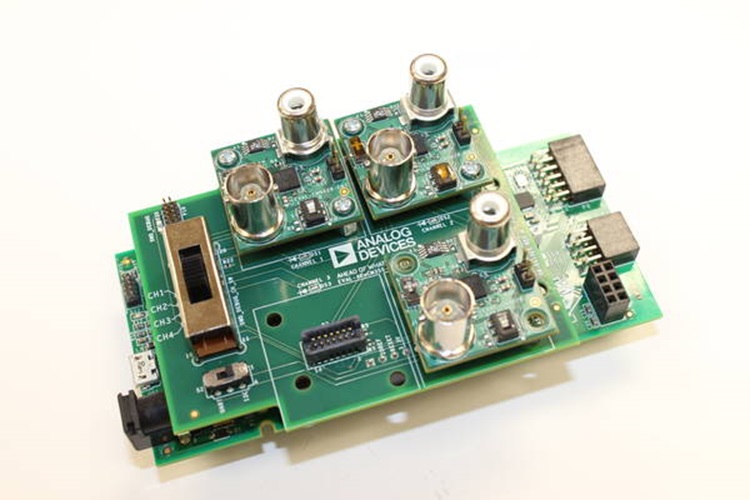
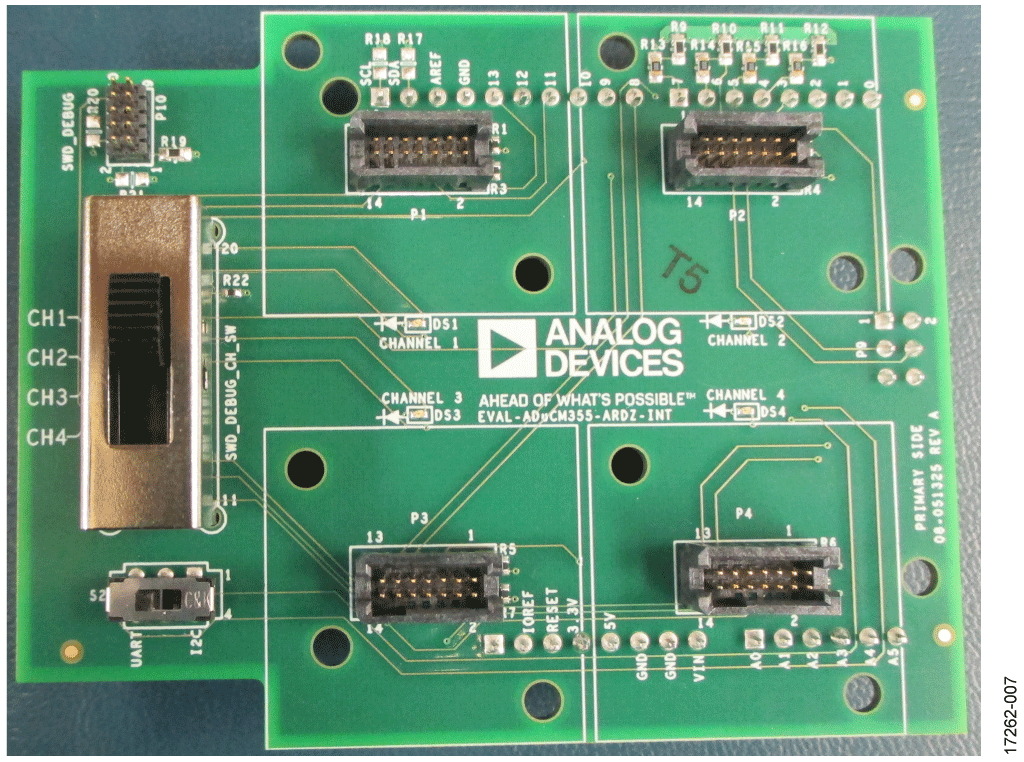
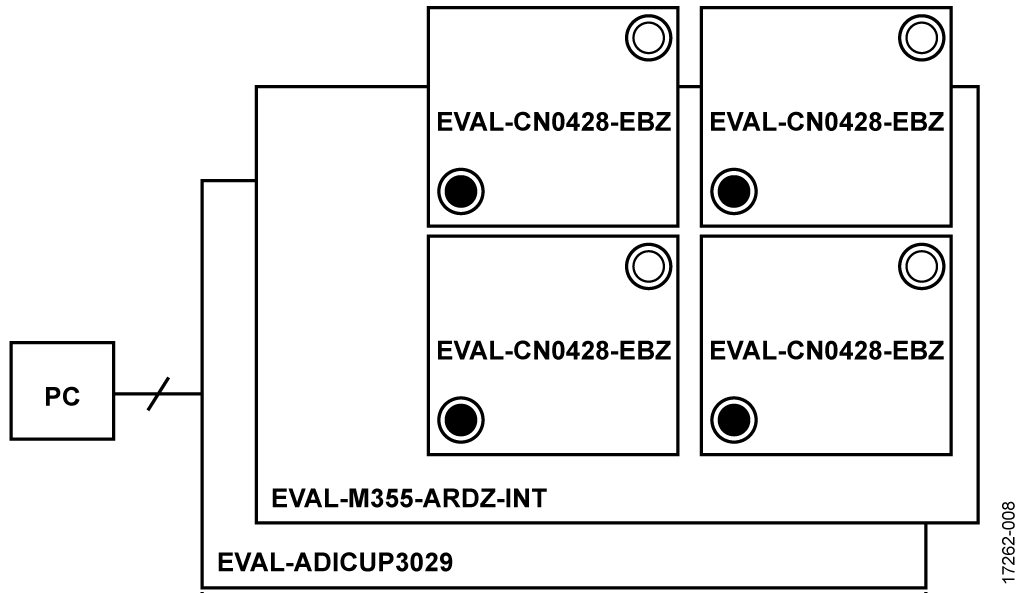
This circuit uses the EVAL-CN0428-EBZ evaluation board (see Figure 5), the EVAL-ADICUP3029 Arduino-based wireless development platform (see Figure 6), and the EVAL-M355-ARDZ-INT Arduino shield interface board (see Figure 7). A user guide for the platform board is available at www.analog.com/EVAL-ADICUP3029.
The system is comprised of the EVAL-ADICUP3029 board, the EVAL-M355-ARDZ-INT Arduino shield board (which plugs into the EVAL-ADICUP3029 board), and up to four EVAL-CN0428-EBZ sensor daughter boards that plug into the Arduino shield board. The EVAL-ADICUP3029 Cortex M3 is Arduino compatible, acting as the host MCU. Its function is to communicate with the measurement engine on the EVAL-CN0428-EBZ daughter boards that interfaces with the sensors.
The Arduino shield is the interface between the EVALADICUP3029 and the sensor board or boards. Up to four sensor boards can be mounted to the shield at one time. The water sensor daughter board showcases the ADuCM355, which interfaces to both BNC and RCA connectors for off the shelf pH, conductivity, ORP, and temperature probes.
Equipment Required
The following equipment is needed:
- EVAL-ADICUP3029 circuit board.
- EVAL-M355-ARDZ-INT Arduino-compatible platform.
- EVAL-CN0428-EBZ water sensor board loaded with firmware (up to four total)
- PC with a USB port and Windows® 7 (32-bit) or higher.
- Serial terminal software (PuTTY, Tera Term, or similar).
- USB type A to micro USB cable.
- Test solutions.
- BNC connectorized probe (up to four)
- RCA connectorized temperature probe (optional, up to four)
- Beaker (optional)
- Probe holder/stand (optional)
- Calibration buffers for probe calibration (optional)
- External debugger or extra EVAL-ADICUP3029 board to enable reprogramming of daughter boards without cutting traces on the EVAL-ADICUP3029 (optional). For additional information on reprogramming the ADuCM355 on the daughter board, refer to the user guide.
Equipment Recommended
The following probes are recommended options:
- Cole-Parmer 100-sereis replacement pH/temperature electrode.
- Cole-Parmer 100-series replacement conductivity/temperature probe, K = 1.
- Sensorex S550C-ORP heavy-duty ORP sensor.


Setup
To set up the circuit for evaluation, take the following steps:
- Plug up to four EVAL-CN0428-EBZ boards into the EVAL-M355-ARDZ-INT shield board followed by the EVAL-ADICUP3029 circuit board.
- Ensure that the switch settings are correct on both the EVAL-M355-ARDZ-INT and EVAL-CN0428-EBZ evaluation boards.
- Connect the EVAL-ADICUP3029 virtual COM USB port to the PC.
- Set up the serial terminal software to match the setting of the CN-0428 firmware and select the correct virtual COM port.
- Press the reset button on EVAL-ADICUP3029 board, and the software displays the steps of water quality measurements.
The daughter boards ship with dedicated firmware, but provisions are available to program new firmware. The daughter boards can be programmed over USB by the debugger section of the EVAL-ADICUP3029. However, this requires cutting three traces and using the included cable to connect to the EVAL-M355-ARDZ-INT. After cutting these traces, the cable is required to communicate over USB. Other options are to use an additional EVAL-ADICUP3029, or to use an external debugger. See the CN-0428 User Guide for detailed instructions.
Details of the operation of the hardware and software are available in the CN-0428 User Guide, which can be found on the Analog Devices website at www.analog.com/CN0428-UserGuide.

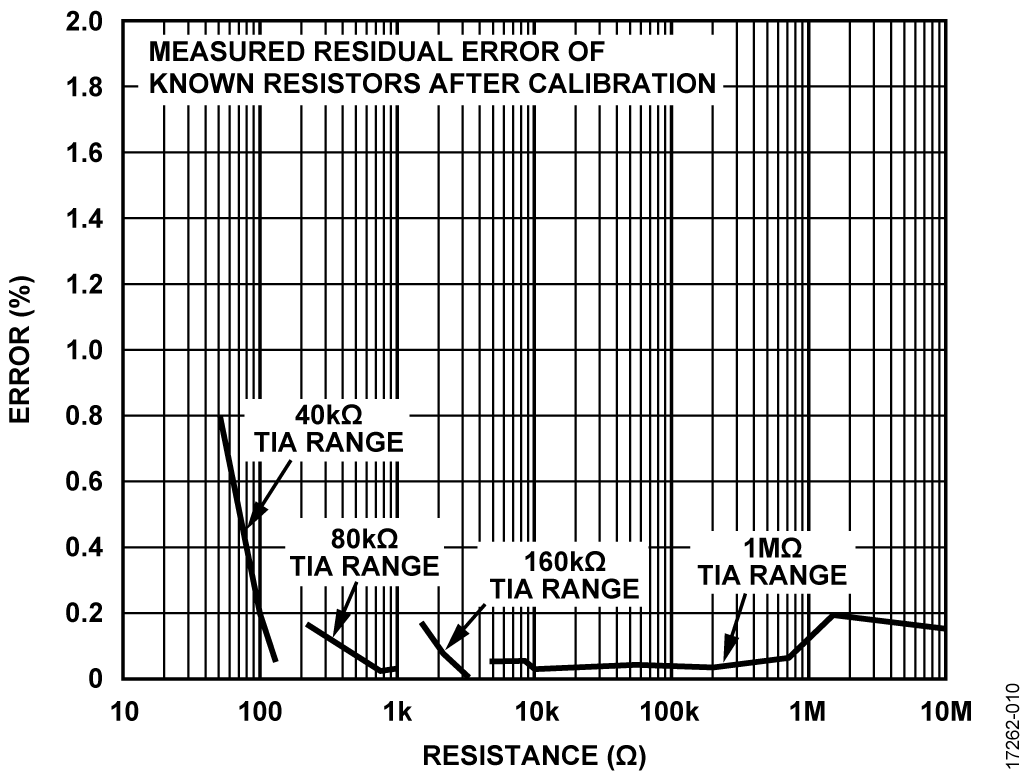
Performance Results
The board has four calibration ranges, dedicated to different gains provided by a TIA. These are internal TIAs with programmable gains. Figure 10 shows the percent error after calibration when measuring known resistor values across the different gain ranges. The plot demonstrates the accuracy of the system to measure known impedances. Known resistor calibration helps to improve accuracy of impedance-based measurements by compensating for switch resistances and leakage of the ADuCM355 switch matrix. Individual boards can be further calibrated for better accuracy. See the CN-0428 User Guide for further information.

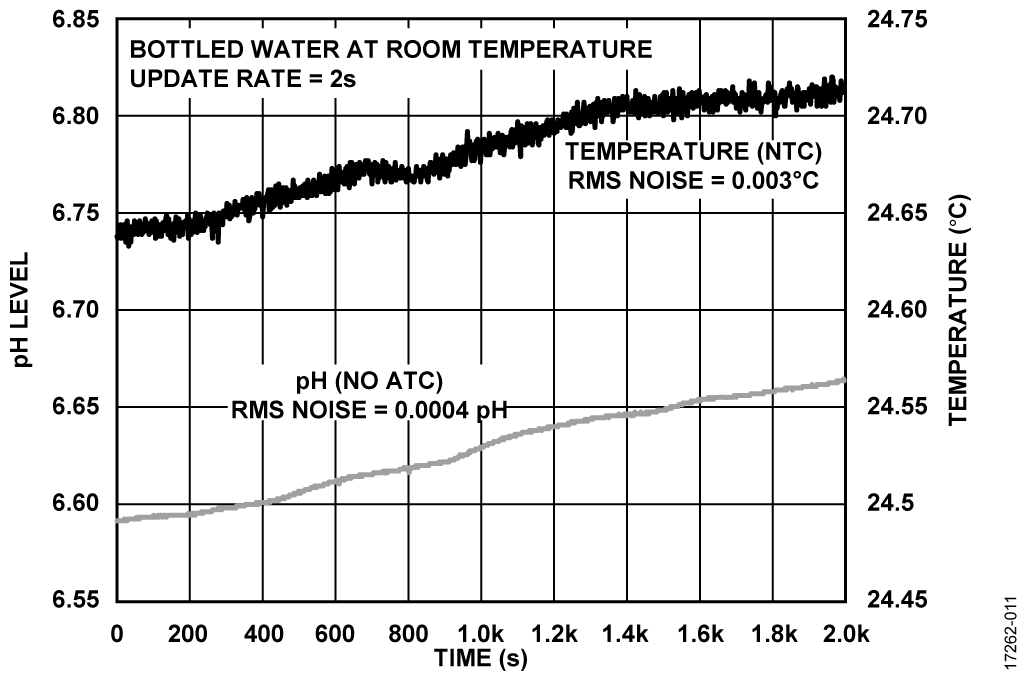
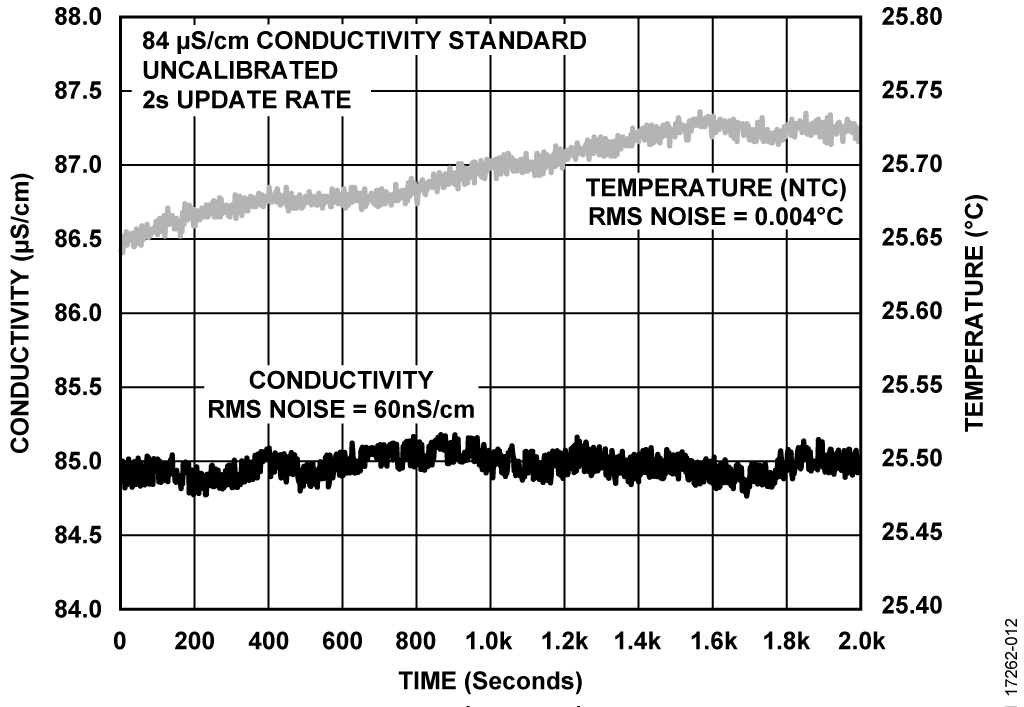
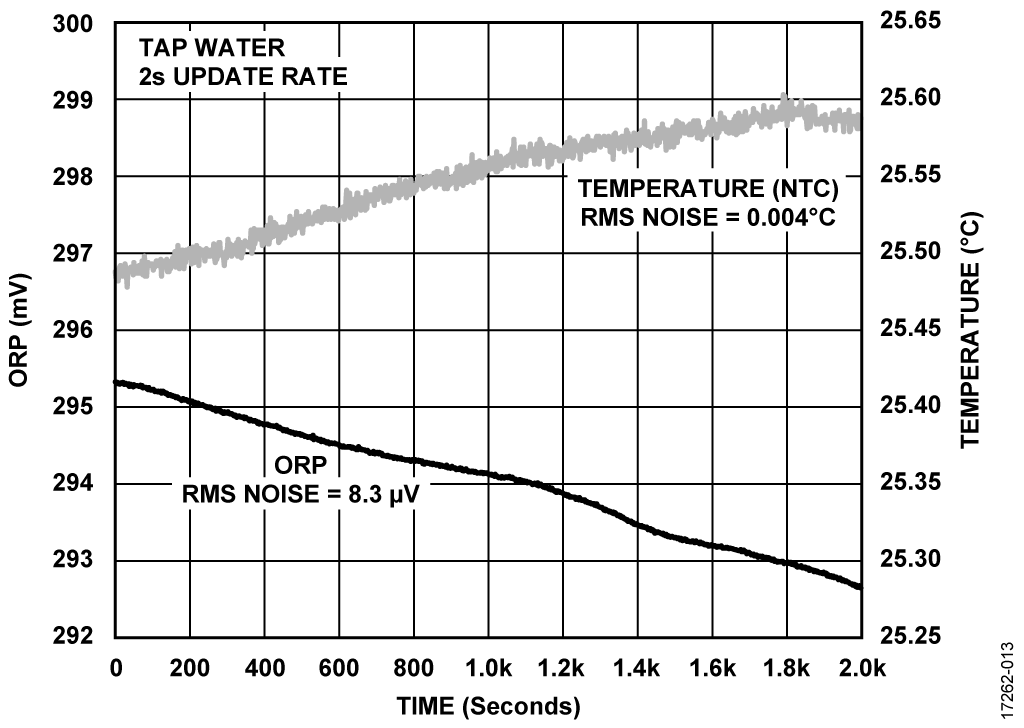
The sensor board was then used to evaluate its performance by testing pH level and conductivity of a bottled water at room temperature. Figure 11, Figure 12, and Figure 13 are example plots obtained for pH, conductivity, and ORP, respectively.