Explaining Valley Current Protection for MAX20730, MAX20733, MAX20734, MAX20735, MAX20743, and MAX20745
Explaining Valley Current Protection for MAX20730, MAX20733, MAX20734, MAX20735, MAX20743, and MAX20745
Abstract
The MAX20730, MAX20734, and MAX20743 switching regulators with PMBus operate from 4.5V to 16V and require up to 35A. When using switching regulators for 12V bus systems, overcurrent protection (OCP) is important. This application note explains how to use Maxim’s implemented valley current-mode algorithm to set the OCP values. This application note also applies to the MAX20733, MAX20735, and MAX20745 devices without the PMBus interface.
Introduction
For 12V distributed bus systems for communication, networking, servers, and storage equipment, Maxim Integrated offers a series of integrated step-down regulators with PMBus operating from 4.5V to 16V and requiring up to 35A. As with all switching regulators, overcurrent protection (OCP) is a crucial and important operation circuit function. For these point-of-load (POL) converters, Maxim implements an advanced valley current-mode algorithm that supports all MLCC output capacitors and fast transient response. The purpose of this application note is to clearly explain how to interpret the OCP data sheet specifications.
How to Set OCP Values
For the MAX20730, MAX20734, MAX20743, the OCP values can be set using the PGMB pin For the MAX20733, MAX20735, and MAX20745, the OCP values can be set using the PGM3 pin. The PGM pins are used to set up some of the key programmable features of the regulator IC. A resistor and capacitor are connected to the PGM pins and their values are read during power-up initialization (e.g., power must be cycled to re-read the values). Table 1 found in the MAX20743 data sheet outlines the resistor values for a given OCP setting with four possible OCP settings for each RGAIN value. For the MAX20730, MAX20733, MAX20734, MAX20735, and MAX20745 OCP settings, refer to the respective IC data sheet.
Additionally, the overcurrent protection level can be adjusted via PMBus for the MAX20730, MAX20734, and MAX20743. Refer to application note 6042, "PMBus Protocols for Controlling and Monitoring the MAX20743/MAX20730 Switching Regulators" for more details.
| Number | R (kΩ) ±1% | RGAIN (mΩ) | OCP (A) |
| 1 | 1.78 | 3.6 | 20 |
| 2 | 2.67 | 3.6 | 25 |
| 3 | 4.02 | 3.6 | 30 |
| 4 | 6.04 | 3.6 | 35 |
| 5 | 9.09 | 1.8 | 20 |
| 6 | 13.3 | 1.8 | 25 |
| 7 | 20 | 1.8 | 30 |
| 8 | 30.9 | 1.8 | 35 |
| 9 | 46.4 | 0.9 | 20 |
| 10 | 71.5 | 0.9 | 25 |
| 11 | 107 | 0.9 | 30 |
| 12 | 162 | 0.9 | 35 |
Defining the Valley Current Inception Point
To define and explain the valley current inception point, it is necessary to do a quick review on how to calculate the peak-to-peak inductor current to provide greater clarity on the valley current inception point and the actual overcurrent clamp value.
Step 1: Calculate Duty Cycle
| D = VOUT/(VIN × n) | (Eq. 1) |
where:
VIN = input voltage
VOUT = desired output voltage
n = efficiency of converter (near OCP limit)
Step 2: Calculate Inductor Ripple Current
| ΔIL = ((VIN – VOUT) x D)/(fS x L) | (Eq. 2) |
where:
VIN = Input voltage
VOUT = desired output voltage
D = duty cycle calculated from Equation 1
fS = switching frequency
L = inductor
We use the MAX20743EVKIT as a typical application for a 12V to 1V conversion. Using the following typical values:
VIN = 12V
VOUT = 1V
L = 170nH
fSW = 400kHz
OCP = 35A
ILOAD = 34A
Typical Efficiency = 84% (taken from data sheet)
Using Equations 1 and 2:
Duty cycle = 0.099 or 9.9%
ΔIL = 16.014A, this is the peak-to-peak current through the inductor.
In current-mode control architecture, these parts provide inherent current limiting and short-circuit protection. The bottom switch’s instantaneous current is monitored using integrated current sensing and controlled on a cycle-by-cycle basis within the control block. Current clamping occurs when the minimum instantaneous ("valley") low-side switch current level exceeds the IOCP threshold current, as shown in Figure 1, where IOCP is the value found in the data sheet. In this situation, turn-on of the high-side switch is prevented until the current falls below the threshold level. Since the valley current is the parameter being controlled, the average current delivered during positive current clamping remains a function of several system level parameters. Note that IOCP has hysteresis and the value drops down to IOCP2 once it has been triggered, as shown in Figure 1.

Figure 1. Overcurrent protection current clamping.
In explaining Figure 1, the stated equation for IOCP(AVG) is the value of the average current once the converter operates in current clamping mode. The IOCP value indicates the current OCP inception point at the minimum valley current. In Figure 1 the current is increasing and when the current in the inductor is decreasing and greater (at its lowest point) than the IOCP value, the part enters the current limit upon reaching the Iocp threshold. Once in current limit, the current in the inductor actually ramps below the IOCP due to built-in hysteresis to ensure a predictable turn-on of the high-side FET. Figure 2 is an actual waveform of the inductor current going into current limit.
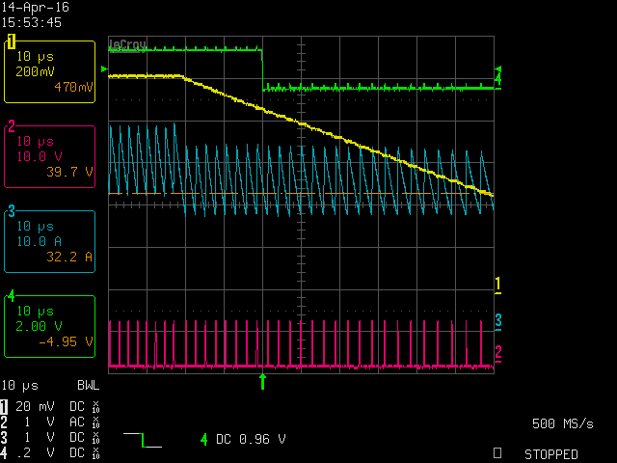
Figure 2. OCP inception point waveform: CH1 (yellow): VOUT, CH2 (pink): Vx, CH3 (blue): I_Ind, CH4 (green): Stat
Hiccup Mode Operation
If the OCP condition (inductor valley current > IOCP) lasts for more than 2.5ms, the device shuts down and enters hiccup mode. The device subsequently waits 47.5ms before it attempts to restart. Repeated OCP shutdowns are each followed by such restart attempts. Waveforms for the part entering and exiting hiccup mode are demonstrated by Figure 3 and Figure 4 respectively.

Figure 3. Entering hiccup mode waveform: CH1 (yellow): VOUT, CH2 (pink): Vx, CH3 (blue): I_Ind, CH4 (green): Stat.

Figure 4. Exiting hiccup mode waveform: CH1 (yellow): VOUT, CH2 (pink): Vx, CH3 (blue): I_Ind, CH4 (green): Stat.
Summary
From Figure 2 it can be shown that the average current just before current limit occurs is actually IOCP + 1/2 inductor peak-to-peak current (calculated from equations 1 and 2). This is shown in the beginning of the inductor current waveform (blue) before VOUT (yellow) starts to drop. The second half of the waveform where VOUT starts decreasing shows the average OCP current, which is defined by the equation in Figure 1 when the inductor current decreases to IOCP(AVG). The IOCP(AVG) is the actual average clamped current when the MAX207xx is in current limit. From the previous example for a 12V to 1V conversion, we calculated the peak-to-peak inductor current to be 16.014A. So, for an OCP inception point of 35A, the actual average output current just before OCP is activated is slightly less than 35 + 1/2 x 16.014 = 43.007A. From the equation in Figure 1 we can calculate that the IOCP average clamping current is equal to 36.0A for this example.