Introduction
Fluid-level measurements can be accurately measured through the wall of a nonmetallic tank by placing an air-dielectric transmission line up against the side of the tank and sensing the RF impedance. This article provides an empirical design example that illustrates how a reflectometer device such as the Analog Devices ADL5920 can simplify the design.
Compared to traditional methods of fluid-level sensing that might involve mechanical floats, the reflectometer-based solution offers several benefits, including:
- Fast, real-time fluid-level measurements
- Extensive electronic postprocessing becomes possible
- Contactless design (no contamination of the liquid)
- No moving parts
- Minimal radiated RF field (far field cancels)
- No holes in the tank for an internal sensor (reduce possibility of leaks)
- Intrinsic safety, due to no electrical wires or parts in the tank
Fluid-Level Measurement Overview
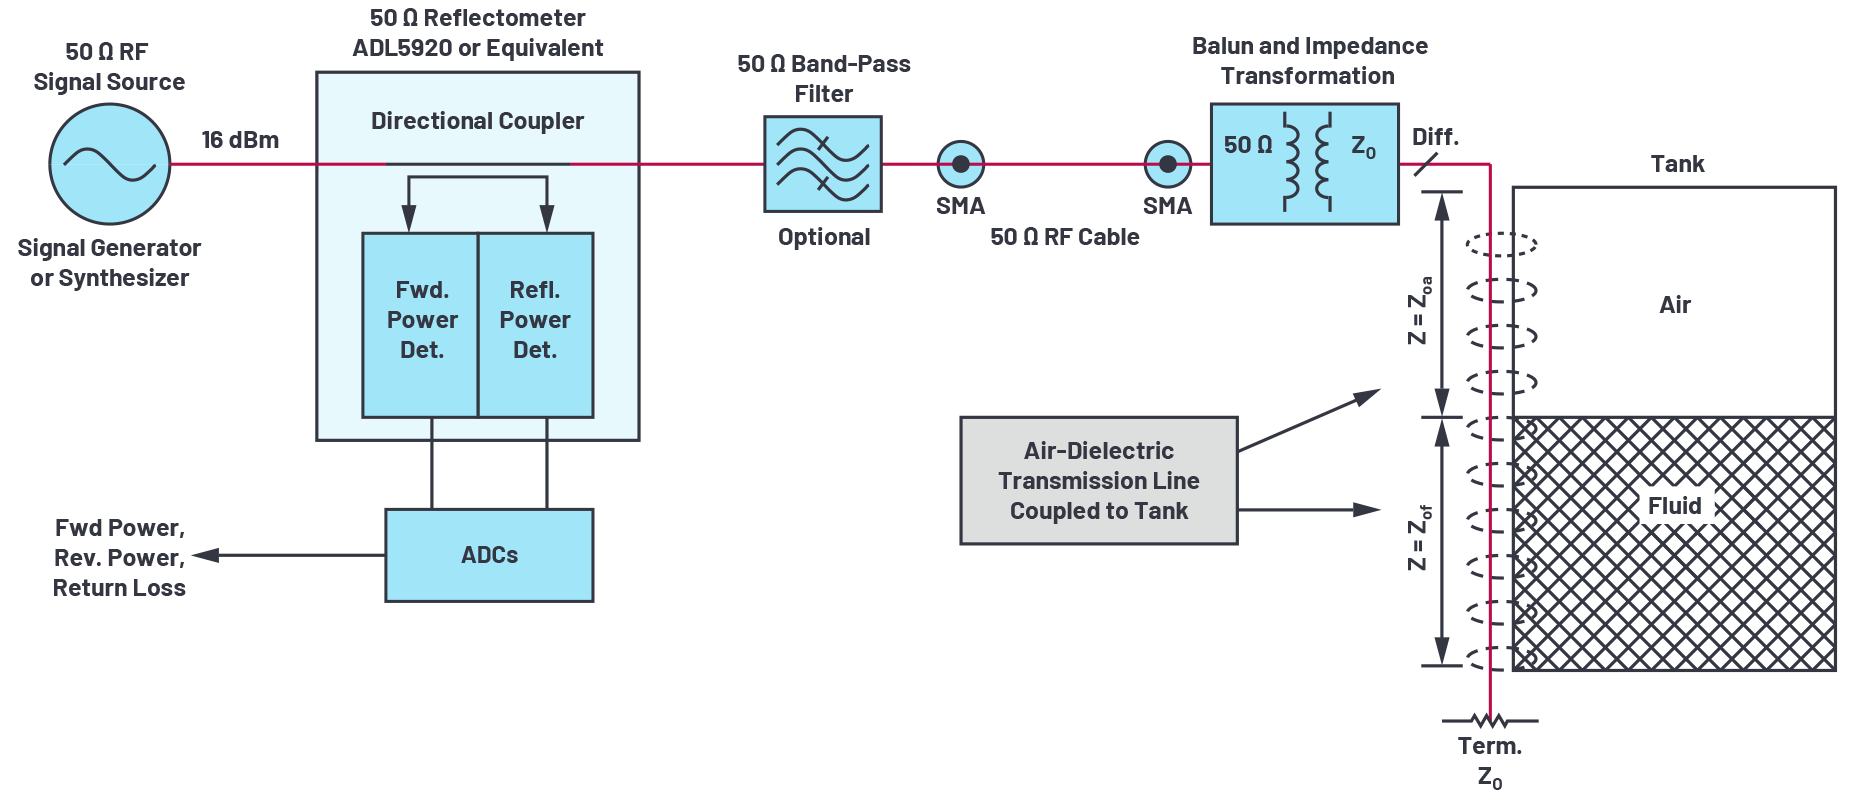
Figure 1 shows a block diagram of the overall system, consisting of an RF signal source driving a balanced and terminated air-dielectric transmission line with a reflectometer located inline.

Principle of Operation
Transmission lines suspended in air can be designed for precise characteristic impedance and low RF loss as a result of low loss conductors and the lack of solid dielectric material. Classical plots of E and H vectors show that the electric and magnetic fields are concentrated around the conductors, and their magnitude decays quite rapidly with distance, where distance is measured relative to the size and spacing of the transmission line structure itself. Any nearby dielectric material such as a fluid tank wall and the fluid within will alter the transmission line’s electrical characteristics,1 which can be summarily measured with a reflectometer such as the ADL5920.
Detailed Description
Consider the case of an air-dielectric, low loss transmission line designed for a specific characteristic impedance ZO in air. Any added dielectric substance such as a fluid in the near field of the transmission line will:
- Lower the characteristic impedance of the transmission line,
- Reduce the velocity of propagation, thus increasing the effective electrical length of the line, and
- Increase attenuation of the line.
All three of these effects can combine to create a reduction in return loss, which is directly measurable with a reflectometer device or instrument. With careful design and calibration, return loss can be correlated to fluid level.
To simplify the analysis, consider the air-dielectric transmission line of Figure 1 with impedance set equal to ZO before attaching the line to the tank. Because the line is terminated with ZO, theoretically, there is no reflected energy, and return loss is infinite.
After the transmission line is affixed to the side of a tank, what was one transmission line now behaves as two separate transmission lines, cascaded in a series configuration:
- Above the fluid level, the transmission line is air dielectric, except for the tank wall material. Transmission line impedance ZOA is changed little from its air dielectric value, ZO. The same is true for transmission line velocity of propagation.
- Below the fluid level, the transmission line impedance ZOF becomes lower compared to ZOA. Electrical length effectively increases, as does attenuation, all because of the extra dielectric material present in the near field of the transmission line.
The impedance of the termination ZO at the far end of the transmission line will be transformed when measured by the reflectometer at the source end of the transmission line. The transformation is depicted graphically, approximately as shown in Figure 2. Because ZOF is lower than ZO, a clockwise Smith chart rotation is created, as shown by the arrows.

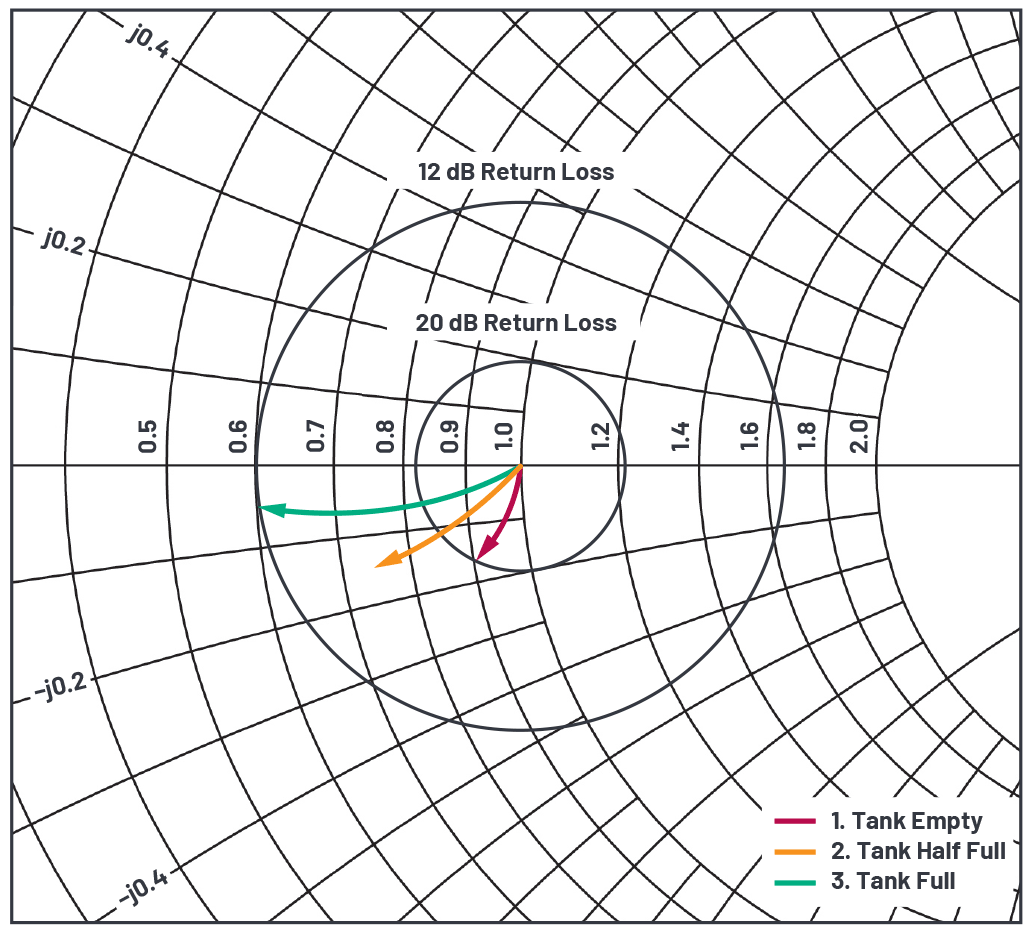
When the transmission line impedance is precisely matched to the resistive termination at the end of the line, there shall be no impedance transformation due to the transmission line. This condition corresponds to the center of the Smith chart, Figure 2, which shows a normalized impedance of 1+j0 Ω. Return loss should be at least 26 dB before the transmission line is attached to the tank.
After attaching the transmission line to an empty tank, the wall material of the tank will contribute some extra dielectric material to the transmission line, thus lowering the impedance of the line to ZOA, and slightly increasing effective electrical length of the transmission line, Trace 1, as exemplified in Figure 2. Return loss should still measure quite well at approximately 20 dB.
As the fluid level rises in the tank, transmission line impedance becomes reduced due to fluid displacing a portion of the air as the dielectric transmission. Transmission line impedance that was ZOA now becomes ZOF. Hence, the center of rotation on the Smith chart moves lower. Simultaneously, the amount of Smith chart rotation increases, because the effective electrical length of the transmission line is increasing. This is depicted by Trace 2 and Trace 3 in Figure 2. Consequently, the reflectometer measures reduced return loss at the generator end of the line.
Because the ADL5920 measures reflection magnitude, not phase, the impedance transformation should be constrained to the bottom half of the Smith chart where the reactive component is negative. Otherwise, impedance is being transformed back toward the center of the Smith chart, causing a magnitude measurement ambiguity. This means the electrical length of the transmission line attached to a full tank should be 90° or less. If electrical length exceeds 90°, the measured return loss will appear to foldback.
A bidirectional RF detector such as the ADL5920 can measure both incident and reflected power in units of dBm, along an RF transmission line of characteristic impedance ZO = 50 Ω. The ADL5920 is also able to subtract these two readings, directly measuring return loss in dB.
What Is Return Loss?
Simply stated, when an RF source is connected to a load, some of the power will be transferred to the load, and the remainder will be reflected back toward the source. The difference between these two power levels is the return loss. It’s essentially a measure of how well-matched the load is to the source.
Purpose of the Balun
The balun serves to drive each conductor with equal but opposite polarity ac voltage, and thus serves two primary purposes:
- Reducing stray RF coupling to and from the transmission line. This is important for regulatory emissions and susceptibility compliance. Far-field EMI in either direction is reduced by cancellation.
- Transforming impedance. Higher impedance means wider spacing of the transmission line elements, which means deeper electric field penetration into the container. The result is more change in return loss vs. fluid level, which means a more sensitive fluid-level measurement.
The balun should be designed to provide good common-mode rejection ratio (CMRR) over the entire pass band of the band-pass filter.
Is a Band-Pass Filter Necessary?
The optional band-pass filter of Figure 1 is recommended whenever stray RF could couple into the transmission line. A band-pass filter will be very helpful for reducing or eliminating interference from Wi-Fi, cellular, and PCS services, land mobile radio, and all other outside signals that are not in the same frequency band as the desired source.
For best results, it is recommended that the band-pass filter design features low insertion loss, with return loss commensurate with that of the return loss measurement; that is, approximately 30 dB or better if possible.
Basic Design Procedure
The design procedure outline is approximately as follows:
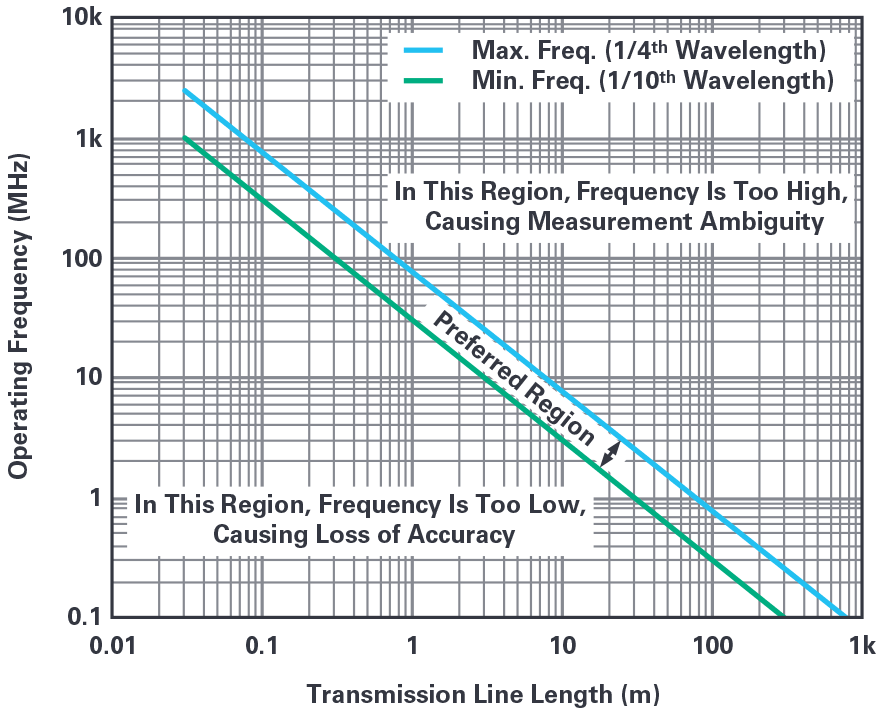
- Choose an operating frequency based on the length of the transmission line. Normally, the transmission line length will be about the same as the tank height or slightly longer. Operating frequency should be chosen such that transmission line length is typically one-tenth to one-fourth of the RF wavelength in the air. Figure 3 illustrates this approximate frequency range. A lower frequency will give the best linearity of return loss vs. fluid level, while a higher frequency will give a larger range of return loss signals, but linearity may not be as good, and measurement foldback may occur (Figure 2). If radiated emissions compliance is required, the frequency may be chosen from the list of applicable ISM frequencies.2
- Design or choose a balun for the chosen frequency, or frequency band. The balun can be a lumped-element LC or transformer based. The balun should exhibit excellent return loss when terminated at the balanced end.
- Calculate the conductor width and spacing dimensions of the transmission line. A transmission line impedance calculator such as an arbitrary transmission line calculator (ATLC) is useful for this purpose.3

A Simple Design Example
For demonstration purpose, a fluid-level monitor for an automotive windshield washer tank was devised. The test setup moves water between two identical tanks, one of which is to have a transmission line attached, for fluid-level measurement.
In accordance with the previous outline:
- Because tank height is approximately 6" (0.15 m), a target RF excitation of about 300 MHz is appropriate (see Figure 3).
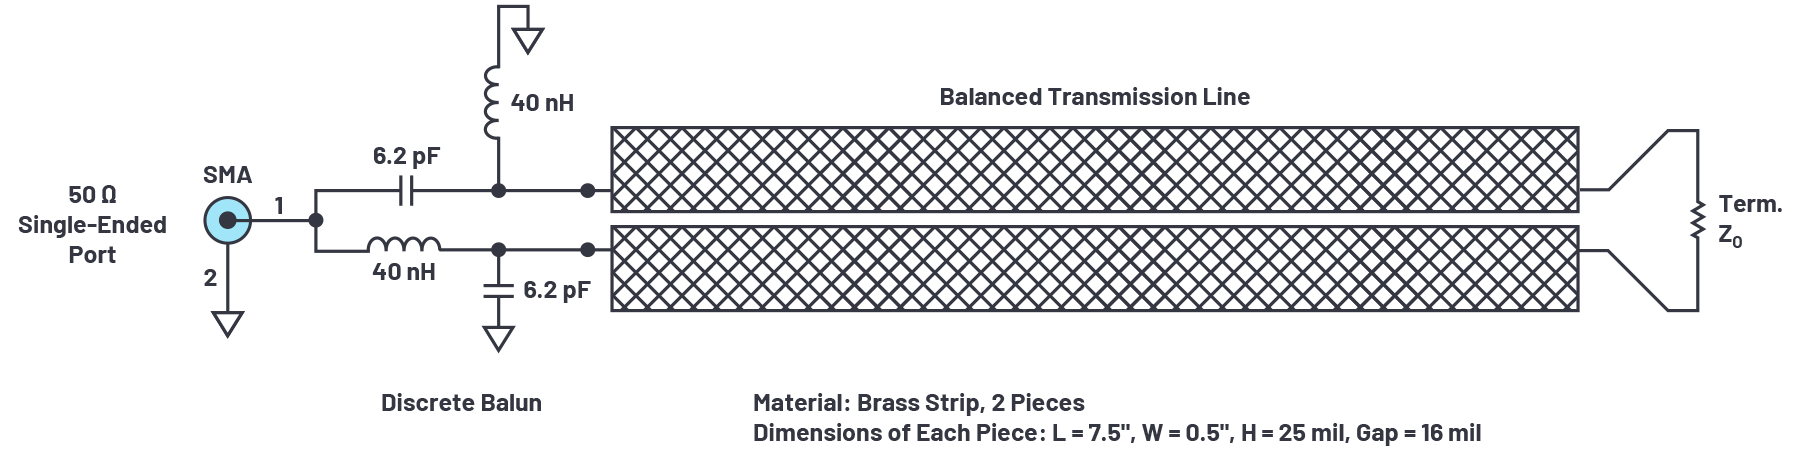
- Next, an LC balun is designed and constructed for this frequency range. A slight step-up impedance transformation to ZO is desired to increase sensitivity to the fluid-level variation4 (see Figure 4). A network analyzer or reflectometer is used to verify approximately 30 dB or better return loss on the single-ended port, with the fixed resistive termination connected directly to the balun, before connecting the transmission line.
- A parallel transmission line is designed and fabricated with ZO equal to the resistor value previously used. The transmission line is connected in-circuit, and the resistor termination moves to the end of the line. See Figure 4 and Figure 5. The network analyzer or reflectometer is again used to verify that return loss remains good—approximately 25 dB or better.


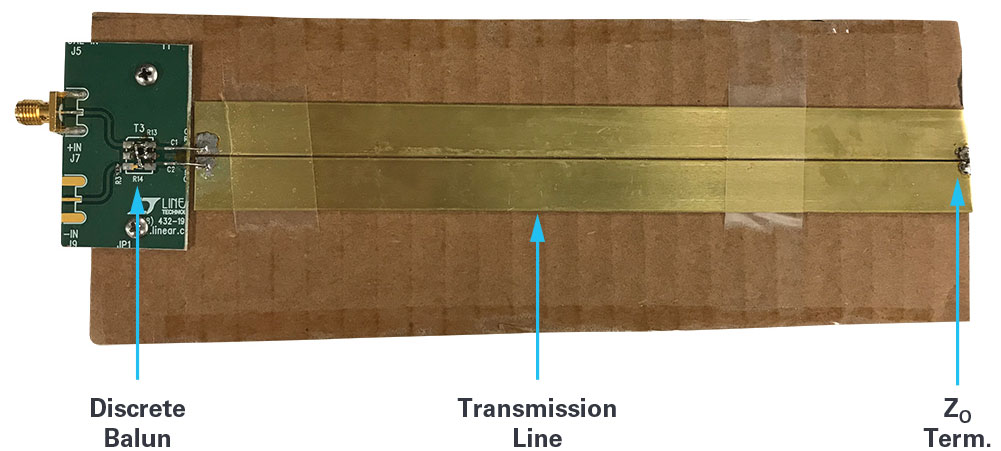
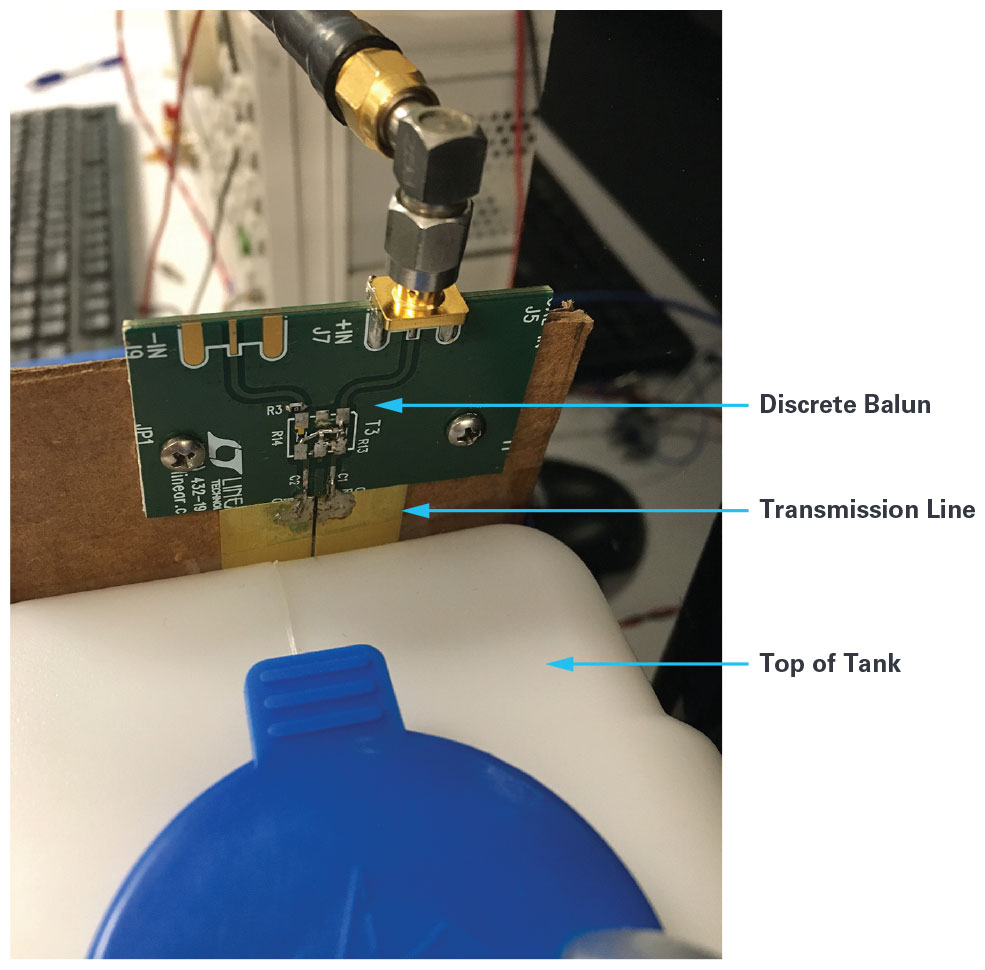
Now the transmission line may be attached to the side of the tank, as shown in Figure 6. It’s normal to observe return loss drop slightly when affixed to an empty tank due to the detuning effect of the tank wall material as an additional dielectric layer on the transmission line.

Example Test Results
Figure 7 shows a complete test setup. The transmission line is affixed to the side of a tank, and the tank has provision for filling and draining in a controlled manner.
Analog Devices’ evaluation kit DC2847A is used to easily read ADL5920 reflectometer measurement results. This evaluation kit includes a mixed-signal MCU to read the forward and reflected detector analog voltages. PC software will automatically load and display results in graphical format vs. time. Return loss is easily calculated as the difference between forward and reflected power measurements. Figure 7 shows the complete test setup for the design example.

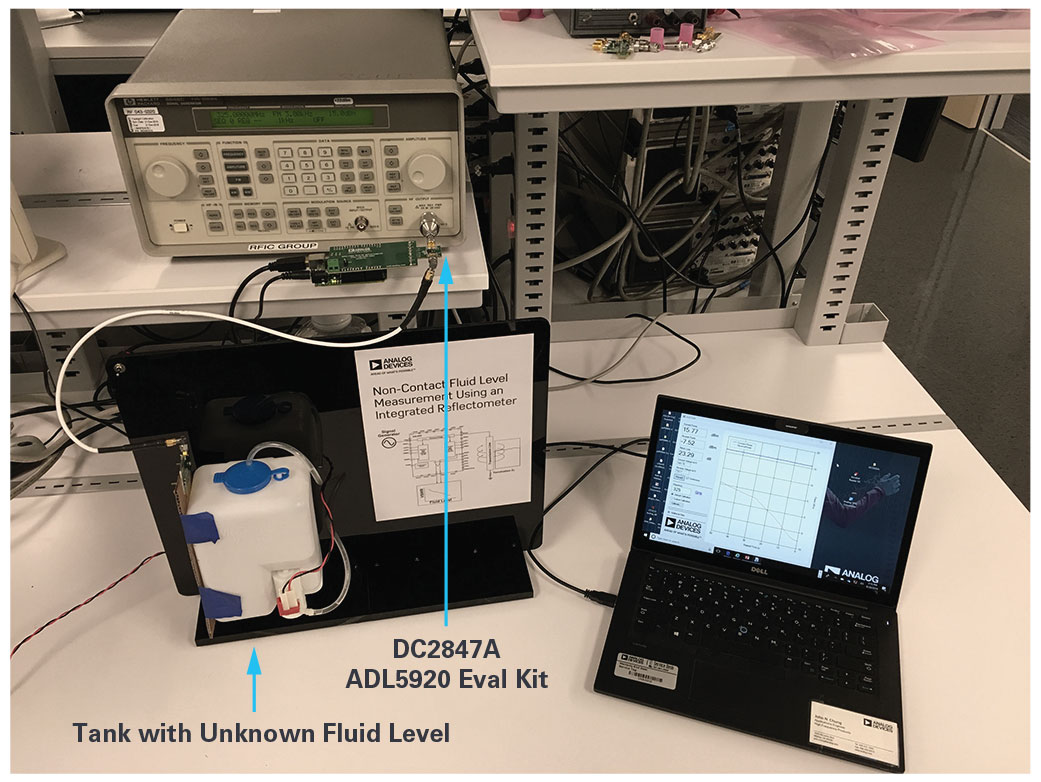
In this design example, fluid-level conditions are established by activating a pump on one of the two tanks. Mass flow rate is relatively constant when a pump is running, so ideally the fluid level in the tank ramps linearly with respect to time. In practice, the tank cross-section is not fully consistent from top to bottom.
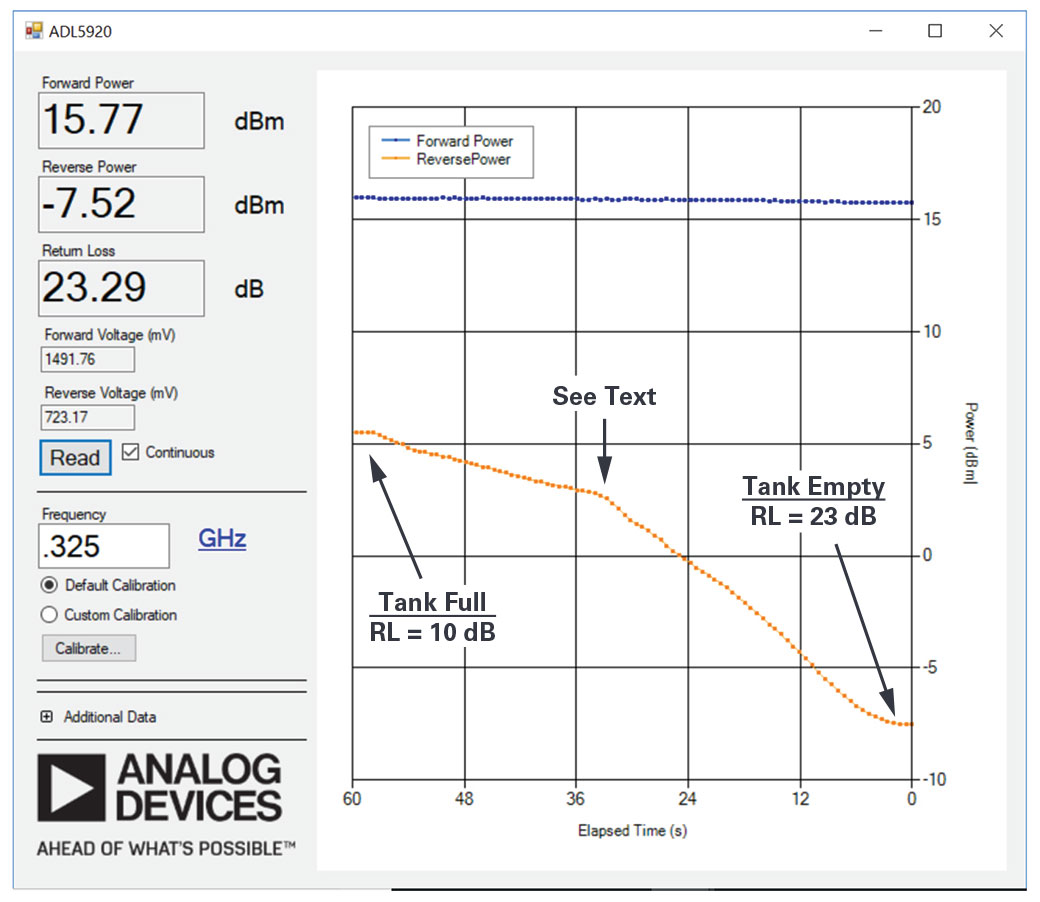
Figure 8 shows the test results as fluid level goes from full to empty. As fluid is pumped out of the tank, forward power holds constant, while reflected power falls relatively linearly.
At t = 33 seconds, a visible change in slope occurs. This is believed to be due to the design of the tank. The cross-sectional area of the tank is reduced at the lower end of the tank, as seen in Figure 7, to create space for the pump motor. This introduces a measurement nonlinearity that could be easily corrected in the system firmware if necessary.

Calibration
For best accuracy, reflectometer calibration is required. Calibration will correct for the manufacturing variation of the RF detectors within the reflectometer—namely slope and intercept. The DC2847A evaluation kit supports individual calibration, as seen in Figure 8.
At a higher level, the fluid level vs. return loss also needs calibration. This can be due to the following sources of uncertainty:
- Manufacturing variation of the distance between transmission line and tank wall.
- Variation in tank wall thickness.
- Fluid and/or tank wall dielectric properties could vary vs. temperature.
Systematic nonlinearities may exist, for example, the change in slope observed in Figure 8. If linear interpolation is used, a three-or-more point calibration becomes necessary in this case.
All calibration coefficients will typically be stored in the system’s nonvolatile memory, which could be unused code space in an embedded processor application, or a dedicated nonvolatile memory device.
Fluid-Level Measurement Limitations
Directivity of any reflectometer is a key specification. Neglecting balun losses, when the transmission line is precisely terminated with its own ZO, reflected power goes to zero, and the reflectometer measures its own directivity specification. The higher the directivity specification, the better the ability of the reflectometer to accurately separate the magnitudes of incident and reflected waves.
For the ADL5920, directivity is specified as 20 dB typical at 1 GHz, increasing to approximately 43 dB typical at 100 MHz or lower. This makes ADL5920 well suited for fluid-level measurements where tank height is about 30 mm or higher (see Figure 3).
Application Extensions
For some applications, the basic contactless fluid-level measurement principle can be extended in several ways. For example:
- The measurement may be performed at low duty cycle to conserve power.
- If the fluid level is held constant, return loss measurement may correlate to another fluid property of interest; for example, viscosity or pH.
- Each application is unique. For example, there are some techniques that might offer better accuracy up at the top end of the scale, compared to the bottom end, or vice versa, depending on the application.
- If the tank is metallic, the transmission line will need to go inside the tank. Depending on the application, the transmission line may be submersed.
- Measurements at more than one RF power level can help identify if external RF interference is a contributing error. Many single-chip PLL devices support this feature, which becomes a confidence test for the system, or a self-test.
- Transmission line sensors on two or four sides of the tank can compensate for container tilt along one axis or two axes, respectively.
- If fluid-level threshold measurement is the goal, one or more shorter transmission lines operated at higher frequency can be a good solution.
Conclusion
The development of a single-chip reflectometer device such as the ADL5920 brings with it new types of applications, such as fluid-level instrumentation. Eliminating moving parts, such as a mechanical float that has been used for years, will result in a huge reliability increase. Oil- and fuel-level monitoring may also be possible, opening up many new industrial and automotive applications.
Footnotes
1 The presence of fluid affects transmission line impedance, loss, and velocity of propagation.
2 Industrial, scientific, and medical frequencies. Visit en.wikipedia.org/wiki/ISM_band.
3 ATLC: arbitrary transmission line calculator (for transmission lines and directional couplers). Visit atlc.sourceforge.net.
4 Too large of an impedance step-up will make the transmission line difficult to design and transmission line losses may become excessive.
Acknowledgements
The author wishes to thank Michiel Kouwenhoven, James Wong, Bruce Nguyen, and John Chung. Without their guidance and help, this article would not be possible.
