CN0326


Overview
Design Resources
Design & Integration File
- Schematic
- Bill of Materials
- Gerber Files
- Allegro Files
- Assembly Drawing
Evaluation Hardware
Part Numbers with "Z" indicate RoHS Compliance. Boards checked are needed to evaluate this circuit.
- EVAL-CN0326-PMDZ ($58.85) Isolated Low Power pH Monitor with Temperature Compensation
- EVAL-SDP-CB1Z ($116.52) Eval Control Board
- SDP-PMD-IB1Z ($64.74) PMOD to SDP Interposer
Device Drivers
Software such as C code and/or FPGA code, used to communicate with component's digital interface.
AD779x Linux GitHub Driver Source Code
Features & Benefits
- 0.5% Accuracy
- Low power
- Temperature compensation
- Completely isolated
Product Categories
Markets and Technologies
Parts Used
Documentation & Resources
-
CN-0326 Software User Guide10/23/2018WIKI
-
MT-101: Decoupling Techniques2/14/2015PDF954 kB
-
MT-040: Op Amp Input Impedance2/14/2015PDF45 kB
-
MT-023: ADC Architectures IV: Sigma-Delta ADC Advanced Concepts and Applications2/14/2015PDF936 kB
-
MT-038: Op Amp Input Bias Current2/14/2015PDF64 kB
-
MT-037: Op Amp Input Offset Voltage2/14/2015PDF96 kB
-
MT-035: Op Amp Inputs, Outputs, Single-Supply, and Rail-to-Rail Issues2/14/2015PDF115 kB
-
MT-022: ADC Architectures III: Sigma-Delta ADC Basics2/14/2015PDF289 kB
-
MT-095: EMI, RFI, and Shielding Concepts4/10/2009PDF145 kB
-
MT-031: Grounding Data Converters and Solving the Mystery of "AGND" and "DGND"3/20/2009PDF144 kB
-
MT-004: The Good, the Bad, and the Ugly Aspects of ADC Input Noise - Is No Noise Good Noise?3/4/2009PDF342 kB
-
CN0326: Isolated Low Power pH Monitor with Temperature Compensation10/29/2013PDF512 kB
Circuit Function & Benefits
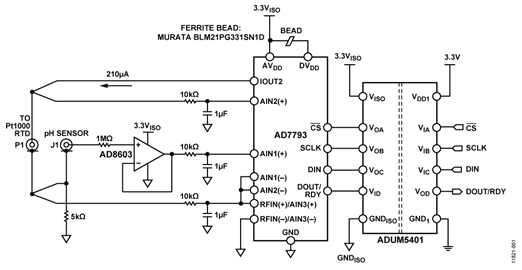
The circuit shown in Figure 1 is a completely isolated low power pH sensor signal conditioner and digitizer with automatic temperature compensation for high accuracy.
The circuit gives 0.5% accurate readings for pH values from 0 to 14 with greater than 14-bits of noise-free code resolution and is suitable for a variety of industrial applications such as chemical, food processing, water, and wastewater analysis.
This circuit supports a wide variety of pH sensors that have very high internal resistance that can range from 1 MΩ to several GΩ, and digital signal and power isolation provides immunity to noise and transient voltages often encountered in harsh industrial environments.


Circuit Description
Fundamentals of pH Measurements
The pH value is a measure of the relative amount of hydrogen and hydroxide ions in an aqueous solution. In terms of molar concentrations, water at 25°C contains 1 × 10⁻⁷ moles/liter of hydrogen ions and the same concentration of hydroxide ions. A neutral solution is one in which the hydrogen ion concentration exactly equals the hydroxide ion concentration. pH is another way of expressing the hydrogen ion concentration and is defined as follows:

Therefore, if the hydrogen ion concentration is 1.0 × 10⁻² moles/liter, the pH is 2.00.
The pH electrodes are electrochemical sensors used by many industries but are of particular importance to the water and wastewater industry. The pH probe consists of a glass measuring electrode and a reference electrode, which is analogous to a battery. When the probe is place in a solution, the measuring electrode generates a voltage depending on the hydrogen activity of the solution, which is compared to the potential of the reference electrode. As the solution becomes more acidic (lower pH) the potential of the glass electrode becomes more positive (+mV) in comparison to the reference electrode; and as the solution becomes more alkaline (higher pH) the potential of the glass electrode becomes more negative (−mV) in comparison to the reference electrode. The difference between these two electrodes is the measured potential. A typical pH probe ideally produces 59.154 mV/pH units at 25oC. This is expressed in the Nernst equation as follows

The equation shows that the voltage generated is dependent on the acidity or alkalinity of the solution and varies with the hydrogen ion activity in a known manner. The change in temperature of the solution changes the activity of its hydrogen ions. When the solution is heated, the hydrogen ions move faster which result in an increase in potential difference across the two electrodes. In addition, when the solution is cooled, the hydrogen activity decreases causing a decrease in the potential difference. Electrodes are designed ideally to produce a zero volt potential when placed in a buffer solution with a pH of 7.
A good reference on the theory of pH is pH Theory and Practice, Radiometer Analytical SAS, Villeurbanne Cedex, France.
Circuit Details
The design provides a complete solution for pH sensor with temperature compensation. The circuit has three critical stages: the pH probe buffer, the ADC, and the digital and power isolator as shown in Figure 1.
The AD8603, a precision micro power (50 μA maximum) and low noise (22 nV/√Hz) CMOS operational amplifier configured as a buffer to the input of one of the channels of the AD7793.The AD8603 has a typical input bias current of 200 fA that provides an effective solution to the pH probe that has high internal resistance.
The pH sensing and temperature compensation system is based on the AD7793, 24-bit sigma-delta (Σ-Δ) with. It has three differential analog inputs and has an on-chip, low noise, programmable gain amplifier (PGA) that ranges from unity gain to 128. The AD7793 consumes only a maximum of 500 μA making it suitable for any low power applications. It has a low noise, low drift internal band gap reference and can accept external differential reference. The output data rate from the part is software programmable and can be varied from 4.17 Hz to 470 Hz.
The ADuM5401, quad-channel digital isolator with an integrated dc-to-dc converter provides the digital signal and power isolation between the microcontroller and the AD7793 digital lines. The iCoupler chip-scale transformer technology is used to isolate the logic signals and the power feedback path in the dc-to-dc converter.
Buffer for pH Sensor Interface
The electrode of a typical pH probe is made up of glass that creates an extremely high resistance that can range from 1 MΩ to 1 GΩ and acts as a resistance in series with the pH voltage source as shown in Figure 2.

The buffer amplifier bias current flowing through this series resistance introduces an offset error in the system. To isolate the circuit from this high source resistance, a buffer amplifier with high input impedance and very low input bias current is needed for this application. The AD8603 is used as a buffer amplifier for this application as shown in Figure 2. The low input current of the AD8603 minimizes the voltage error produced by the bias current flowing through the electrode resistance.
For 200 fA typical input bias current, the offset error is 0.2 mV (0.0037 pH) for a pH probe that has 1 GΩ series resistance at 25oC. Even at the maximum input bias current of 1 pA, the error is only 1 mV.
The cut-off frequency of the 10 kΩ/1 μF low pass noise filter for the buffer amplifier output is given by f= 1/2πRC, or 16 Hz.
Guarding, shielding, high insulation resistance standoffs, and other such standard picoamp methods must be used to minimize leakage at the high impedance input of the AD8603 buffer.
ADC Channel 1 Configuration, pH sensor
This stage involves measuring the small voltage generated by the pH electrode. Table 1 shows the specifications of a typical pH probe. Based on the Nernst equation, the full range voltage from the probe can range from ±414 mV (±59.14 mV/pH) at 25°C to ±490 mV (±70 mV/pH) at 80°C.
| Measurement Range |
pH 0 to pH 14 |
| pH at zero voltage |
pH 7.00 ± 0.25 |
| Accuracy |
pH 0.05 in the range from 20°C to 25°C |
| Resolution |
pH 0.01 0.1 mV |
| Operating Temperature |
Maximum 80°C |
| Reaction time |
≤1 sec for 95% of final value |
When reading the pH probe output voltage, the ADC uses the external 1.05 V reference and is configured with a gain of 1. The full-scale input range is ±V REF/G = ±1.05 V, and the maximum signal from the pH probe is ±490 mV at 80°C.
Because the output of the sensor is bipolar, and the AD7793 operates from a single power supply, the signal generated by the pH probe should be biased above ground so that it is within the acceptable common-mode range of the ADC. This bias voltage is generated by injecting the 210 μA IOUT2 current into the 5 kΩ, 0.1% resistor as shown in Figure 2. This generates the 1.05 V common-mode bias voltage that also serves as the ADC reference voltage.
ADC Channel 2 Configuration, RTD
The second channel of the ADC monitors the voltage generated across an RTD being driven by the IOUT2 current output pins of the AD7793. The 210 μA excitation current drives the series combination of the RTD and precision resistor (5 kΩ, 0.1%). (See Figure 1).
The temperature coefficient for pure platinum is 0.003926 Ω/Ω/°C. The normal coefficient for industrial RTDs is 0.00385 Ω/Ω/°C per the DIN Std. 43760-1980 and IEC 751-1983. The accuracy of an RTD is usually stated at 0°C. The DIN 43760 standard recognizes two classes as shown in Table 2, and ASTM E–1137 recognizes two grades as shown in Table 3.
| Class |
Tolerance |
| DIN 43760 Class A |
±0.06% @ 0°C |
| DIN 43760 Class B |
±0.12% @ 0°C |
| Grade |
Tolerance |
| ASTM E-1137 Grade A |
±0.05% @ 0°C |
| ASTM E-1137 Grade B |
±0.10% @ 0°C |
The RTD resistance value can be computed as
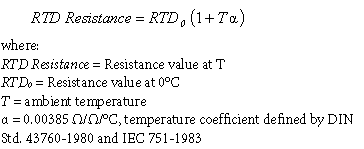
The RTD resistance varies from 0°C (1000 Ω) to 100°C (1385 Ω), producing a voltage signal range of 210 mV to 290 mV with 210 μA excitation current.
The precision 5 kΩ resistor generates the 1.05 V used as an external reference. With a gain of one, the analog input range is ±1.05 V (±VREF/G). This architecture gives a ratiometric configuration. Changes in the value of the excitation current do not affect the accuracy of the system.
Although 100 Ω Pt RTDs are popular, other resistances (200 Ω, 500 Ω, 1000 Ω, etc.) and materials (Nickel, Copper, Nickel Iron) can be specified. This application uses a 1 kΩ DIN 43760 Class A RTD for temperature compensation of the pH sensor. A 1000 Ω RTD is less sensitive to wiring resistance errors than a 100 Ω RTD.
A 2-wire connection is made as shown in Figure 3. A constant current is applied through the leads of the RTD, and the voltage across the RTD itself is measured. The measuring device is the AD7793 that exhibits high input impedance and low input bias current. The sources of errors in this scheme are lead resistance, the stability of the constant current source produced by AD7793, and the input impedance and/or bias current in the input amplifier, and the associated drift.


Another possibility for eliminating wiring resistance errors is the 3-wire RTD configuration that is described in detail in Circuit Note CN-0287.
Output Coding
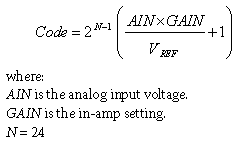
The EVAL-SDP-CB1Z system demonstration platform board and the PC processes the data output from the AD7793.
Digital and Power Isolation
The ADuM5401 isolates the ADC digital signals and also supplies isolated regulated 3.3 V power to the circuit. The input to the ADuM5401 (VDD1) should be between 3.0 V and 3.6 V. Take care with the layout of the ADuM5401 to minimize EMI/RFI problems. For more details, please refer to Application Note AN-1109, Recommendations for Control of Radiated Emissions with iCoupler Devices.
System Calibration
In order to accurately measure the RTD resistance, the ±5% variation in the IOUT2 current must be taken into account. The AIN3(+) input to the AD7793 is used to measure the voltage dropped across the precision 5 kΩ 0.1% resistor. The exact IOUT2 current is then determined by dividing this voltage by 5 kΩ. The RTD resistance is calculated by dividing the voltage across the RTD by the exact IOUT2 current.
A two-point calibration procedure shown in Figure 4 is used to calibrate the pH meter in the EVAL-CN0326-PMDZ evaluation software.

The user is required to use a minimum of two buffer solutions, where a neutral pH buffer with a value of pH-7 should be used to remove the offset introduced by the pH probe and by the system. The neutral buffer solution can be used to set the first point for calibration. The pH of the second buffer solution depends on the pH of the solution to be measured. A pH-10 buffer solution can be used when measuring alkaline base solutions, and a pH-4 buffer can be used when measuring acidic solutions. For more precise measurement, a three point calibration can be performed. This can be done by using two different sets of buffer solutions in Step 2 and in Step 3 as shown in Figure 4, where the pH-7 solution is used to remove the offset.
The software includes a list of buffer solution recommended by the NIST. Each buffer solution described in the list has its own temperature coefficient from 0°C to 95°C, which can be found in “pH Theory and Practice” by Radiometer Analytical. The software uses this table to correlate the mV input from the pH probe to the correct pH value that correspond to the temperature read from the RTD sensor using linear interpolation to fill in the gaps in the table. The user is given an option to enable/disable the option for continuous temperature compensation by clicking the green button as shown in Figure 4.
Buffer solutions are commonly found in the market for pH sensor calibration. Other NIST-certified pH reference can also be used for calibration. Because of the variety of buffer solutions available, the software also provides the user an option to use their desired NIST-certified pH reference for calibration as shown in Figure 4.
The software also provides the user an option to use other RTD resistance values, but by default it is set to 1000 Ω.
System Noise Considerations
For an output data rate of 16.7 Hz and a gain of 1, the rms noise of the AD7793 equals 1.96 μV (noise is referred to input, taken from AD7793 data sheet). The peak-to-peak noise is
6.6 × RMS Noise = 6.6 × 1.96 μV = 12.936 μV
If the pH meter has a sensitivity of 59 mV/pH, the pH meter should measure the pH level to a noise-free resolution of
12.936 μV / (59 mV/pH) = 0.000219 pH
This includes only the noise contribution of the AD7793. The actual system results are presented in the next section.
Test Data and Results
All data capture was performed using the CN0326 LabVIEW evaluation software. A Yokogawa GS200 precision voltage source was used to simulate the input of a pH sensor.
By sweeping the precision voltage from −420 mV to +420 mV in 1 mV increments, the EVAL-CN0326-PMDZ was able to capture the data according to the user defined calibration option.
The peak-to-peak noise of the AD8603 buffer and the AD7793 in the actual system was determined by shorting the input pH probe BNC connector and acquiring 1000 samples. As seen by the histogram in Figure 5, the code spread is approximately 500 codes, which translates to a peak-to-peak noise of 31.3 μV, with an equivalent pH reading spread of 0.00053 pH peak-to-peak.

The system was tested with three different resistors in series with the ADC input to simulate the different impedances of the high impedance glass electrode. The system was also calibrated to give 60 mV/pH. According to Figure 6, the linearity error increases with the increase of simulated glass electrode impedance. Figure 6 also shows that over the entire simulated pH output voltage range, the linearity error is less than 0.5% with for a 200 MΩ pH probe impedance.


200 MΩ)
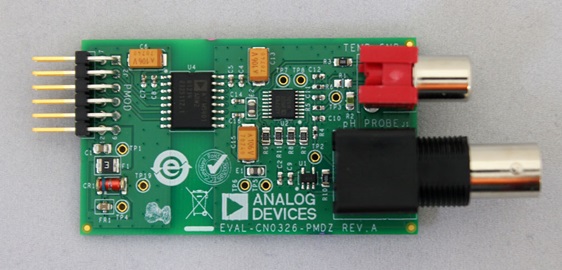
The test data was taken using the board shown in Figure 7. Complete documentation for the system can be found in the CN-0326 Design Support package.


Common Variations
Other suitable ADCs are the AD7792 and AD7785. Both parts have the same feature set as the AD7793. However, the AD7792 is a 16-bit ADC while the AD7785 is a 20-bit ADC.
The AD8607 buffer amplifier is available in an 8-lead MSOP package . It is a dual micropower rail-to-rail input/output amplifier which is in the same family as the AD8603.
Other families of ADuM5401 includes a variety of channel configuration such as the ADuM5402/ADuM5403/ADuM5404 which also provides four independent isolation channels.
Circuit Evaluation & Test
This circuit uses the EVAL-CN0326-PMDZ circuit board, the EVAL-SDP-CB1Z System Demonstration Platform (SDP) evaluation board and the SDP-PMD-IB1Z, a PMOD interposer board for the EVAL-SDP-CB1Z. The SDP and the SDP-PMD-IB1Z boards have 120-pin mating connectors, allowing the quick setup and evaluation of the circuit’s performance. In order to evaluate the EVAL-CN0326-PMDZ board using the SDP-PMD-IB1Z and the SDP, the EVAL-CN0326-PMDZ is connected to the SDP-PMD-IB1Z by a standard 100 mil-spaced, 25 mil square, right angle pin-header connector.
Equipment Required
The following equipment is needed:
- A PC with a USB port and Windows® XP and Windows® Vista (32-bit), or Windows® 7 (32-bit)
- EVAL-CN0326-PMDZ circuit evaluation board
- EVAL-SDP-CB1Z circuit evaluation board
- SDP-PMD-IB1Z SDP interposer board
- CN0326 Evaluation Software
- Power supply: 6 V wall wart or equivalent
- Yokogawa 2000 Precision DC Power Supply or equivalent
Getting Started
Load the evaluation software by placing the CN-0326 Evaluation Software disc in the CD drive of the PC. Using "My Computer," locate the drive that contains the evaluation software disc and open the Readme file. Follow the instructions contained in the Readme file for installing and using the evaluation software.
Setup
The CN0326 evaluation kit includes self-installing software on a CD. The software is compatible with Windows® XP (SP2) and Vista (32-bit and 64-bit). If the setup file does not run automatically, you can run the setup.exe file from the CD.
Install the evaluation software before connecting the evaluation board and SDP board to the USB port of the PC to ensure that the evaluation system is correctly recognized when connected to the PC.
- After installation from the CD is complete, power up the SDP-PMD-IB1Z evaluation board as described in the Power Supplies Configuration section. Connect the SDP board (via either Connector A) to the SDP-PMD-IB1Z evaluation board and then to the USB port of the PC that will be used for evaluation using the supplied cable.
- Connect the 12-pin right angle male pin header of the EVAL-CN0326-PMDZ to the 12-pin right angle female pin header of the SDP-PMD-IB1Z.
- Before running the program shown in Figure 9, connect the pH probe at the BNC terminal and the RTD sensor to the terminal jack of the EVAL-CN0326-PMDZ.
- After all the peripherals and power supply are all connected and turned on, click Connect on the GUI shown in Figure 9. When the evaluation system is successfully detected by the PC, the EVAL-CN0326-PMDZ circuit board can now be evaluated using the software shown in Figure 9.
Functional Block Diagram
The functional block diagram of the test set-up is shown in Figure 8. The test set-up should be connected as shown. A screenshot of the main software window is shown in Figure 9.


Power Supply Configuration
The SDP-PMD-IB1Z must be supplied with 6 V dc power supply and its jumper, JP1, should be set to 3.3 V to give power to the EVAL-CN0326-PMDZ.
Test
Agilent E3631A and Yokogawa GS200 precision voltage supplies were used to simulate the sensor output. The negative terminal of the Yokogawa is connected to the negative terminal of the ADC for the pH sensor. The positive terminal is in series with the resistor, which is connected to the positive terminal of the ADC as shown in Figure 8. The Yokogawa generates the ±420 mV, which then simulates the pH sensor output, and the series resistor is then varied to simulate the impedance of the glass electrode of the pH probe as shown in Figure 8.
The CN-0326 Evaluation Software is used to capture the data from the EVAL-CN0326-PMDZ circuit board using the setup seen in Figure 8.
Details regarding the use of the software can be found in the CN-0326 Software User Guide.