Abstract
Oxygen supply has a vital importance for living cells and tissues. Blood oxygen saturation (SpO2) measurement by pulse oximetry has been an essential physiological monitoring tool for human health for many decades and is an indicator of the oxygen supply to cells and tissues. Maxim has developed high-sensitivity optical sensors with optimized algorithms to accurately measure SpO2 with wearable devices. In this application note, first, we present the theory behind SpO2 measurement by using photoplethysmographic (PPG) signals. Then, we show the details of the algorithm calibration process, which is required to improve the accuracy of the algorithm when Maxim’s sensors are used with different optical shields and form factors. In addition, we demonstrate the algorithm evaluation against clinically relevant accuracy requirements through leave-one-out cross-validation. Finally, we present how the algorithm can be executed with obtained calibration coefficients. We also show the details of the algorithm output data format.
Introduction
Pulse oximetry (percentage of SpO2 concentration in blood) has been used as a key health indicator for many decades. Although the original academic development was made in 1935, the modern basis for determining the SpO2 concentration using light sources and photosensor(s) was developed by Takuo Aoyagi and Michio Kishi in 1972. When commercially feasible, SpO2 concentration measurement devices have made huge gains in medical applications. Since 1987, the Standard of Care (SoC) for the administration of a general anesthetic has included pulse oximetry. All modern hospital bedside equipment include an SpO2 module based on the same fundamentals, albeit with minor modifications.
However, these hospital-based devices are expensive and bulky, and in their current form, their use is limited to hospitals, health clinics, and some doctor’s offices. To enable individuals interested in tracking their body’s key health indicators, a solution that is both light enough to wear in comfort and cheap enough for a typical consumer to purchase is needed.
Maxim has a solution that functions as a drop-in module for wrist-worn health bands, as well as finger-based pulse oximetry devices. This application note covers the theory behind pulse oximetry as well as typical design and calibration processes needed to incorporate our solution into various wearable devices.
Principles of SpO2 Measurement
What is SpO2?
Hemoglobin (Hb) is an oxygen-transport protein in red blood cells (RBCs). The two main forms of Hb present in blood are oxygenated hemoglobin (oxy-hemoglobin, HbO2) and deoxygenated hemoglobin (deoxy-hemoglobin, RHb).
SpO2 is a measure of the peripheral capillary oxygen saturation. More specifically, SpO2 is an estimate of the amount of oxygen in capillary blood, which is described as a percentage of the amount of oxy-hemoglobin to total hemoglobin, expressed as follows:

where C[HbO2] and C[RHb] are the concentrations of HbO2 and RHb, respectively.
Beer-Lambert Law
The Beer–Lambert law describes the attenuation of light with the properties of the material through which the light is travelling. According to the Beer-Lambert law,

Or

where A is the attenuation, I0 is the incident light intensity, I is the received light intensity, e(?) is the molar extinction coefficient, C is the concentration of material, and d is the optical path length.
Considering the molecule compound of tissue, Beer-Lambert law can be extended as follows:

The Beer-Lambert law enables us to measure SpO2 by using the molar extinction coefficients of HbO2 and RHb.
Pulse Oximetry
Pulse oximetry is a tool used for the noninvasive measurement of blood oxygenation (i.e., SpO2. Pulse oximetry is based on two principles: modulation of transmitted light by absorption of pulsatile arterial blood and different absorption characteristics of HbO2 and RHb for different wavelengths.
Pulse oximetry can be classified as transmissive and reflective:
- Transmissive pulse oximetry is when the photodiode and the LED are placed on opposite sides of the human body (e.g., finger). The body tissue absorbs some of the light, and the photodiode collects the residual light that passes through the body.
- Reflective pulse oximetry is when the photodiode and the LED are on the same side. The photodiode collects the light reflected from various depths underneath the skin. Maxim’s SpO2 measurement solutions are classified as reflective pulse oximetry.
Figure 1 shows pulsatile arterial blood and other blood and tissue components.

Figure 1. A schematic of pulsatile arterial blood and other blood and tissue components.
The pulsatile arterial blood absorbs and modulates the incident light passing through the tissue and forms the photoplethysmographic (PPG) signal, as shown in Figure 2. The AC component of the PPG signals represents the light absorbed by the pulsatile arterial blood. This AC component is superimposed on a DC signal that captures the effects of light absorbed by other blood and tissue components (e.g., venous and capillary blood, bone, water, etc.). The ratio of the AC signal to the DC level is called the perfusion index (PI).
Note that the DC and AC components of the received PPG signals are different for different LED wavelengths. This is due to the different absorption characteristics of HbO2, RHb, and other tissue components for different wavelengths.

Figure 2. Photoplethysmographic (PPG) signals received by a photodiode from red and infrared LEDs.
Figure 3 shows the molar absorption coefficients of HbO2 and RHb. To measure SpO2, two LEDs with different wavelengths are required. In addition, these two wavelengths should be selected such that the molar absorption coefficients of HbO2 and RHb are well separated. A red LED at 660nm and an infrared LED at 880nm are commonly used in pulse oximetry.

Figure 3. Molar absorption coefficients of HbO2 and RHb.
For more information, a detailed theory of pulse oximetry and noninvasive SpO2 measurement can be found in Development of a fractional multi-wavelength pulse oximetry algorithm[1].
Optical Design Guides
Maxim provides two optical design guides for its customers:
- For a module level design guide, see Application Note 6847: Opto-Mechanical Integration of Heart Rate Monitors in Wearable Earbud Devices[3].
- For a component-level design guide, see Application Note 6846: Opto-Mechanical Integration of Heart-Rate Monitors in Wearable Wrist Devices[4].
Calibrating Maxim’s SpO2 Algorithm
SpO2 measurement is achieved by the following equation:

where R is determined by the following equation:

and a, b, and c are calibration coefficients. This section describes how to obtain these coefficients.
Why is Calibration Required?
The SpO2 measurement performance of a device must be verified before the device is released to the market. The U.S. Food and Drug Administration (FDA) suggests using standards presented in the following:
- ISO 80601-2-61:2017 – Medical electrical equipment -- Part 2-61: Particular requirements for basic safety and essential performance of pulse oximeter equipment
- Pulse Oximeters – Premarket Notification Submissions [510(k)s] Guidance for Industry and Food and Drug Administration Staff
According to these regulations, manufacturers need to declare the calibration range, reference, accuracy, methods of calibration and range of displayed saturation level. Furthermore, for the performance assessment, the FDA requires at least 200 data points equally spaced over a saturation range of 70% to 100%. Test subjects should have different ages, gender, and skin tones. For instance, the FDA requires that at least 30% of the volunteers must have dark skin pigmentation. The overall error or the root mean square error (RMSE) must be below 3.0% for transmissive pulse oximetry and below 3.5% for reflective pulse oximetry.
Maxim’s hardware and algorithm gives FDA-grade SpO2 measurement performance for both finger (implemented on different mobile phones) and wrist (implemented on a wrist watch). However, the FDA requires that a performance analysis of the SpO2 measurement must be done with the whole system and not only with the sensor. Thus, each customer must verify the FDA-grade SpO2 measurement performance in their final products with the optical shield in front of the Maxim sensor.
In addition to the FDA regulations, the theoretical relation between R and SpO2 does not give a satisfactory SpO2 measurement accuracy due to ideal-case assumptions used in pulse oximetry and the different optical properties of the hardware (e.g., optical shield and wide light spectrum of LEDs). Figure 4 shows the theoretical R-curve and calibrated R-curves. The theoretical R-curve does not give accurate SpO2 values.

Figure 4. Theoretical and calibrated R-curves. All phones use the same sensor with different optical shields, which result in slightly different R-curves.
In addition, Figure 4 shows the effect of a cover shield in front of the sensor. Although, all phones use the same sensor, their calibrated R-curves are slightly different from each other. Thus, a calibration process is required to obtain calibration coefficients for better measurement accuracy by compensating for the deviations from the Beer-Lambert law and the non-idealities of the hardware. These coefficients are obtained after collecting comprehensive data in a 3rd party calibration lab.
In the calibration lab, the SpO2 level of the test subjects are varied in a controlled manner and the PPG signals measured from the test subjects are recorded. During data collection, the test subjects use a gas mask to control their SpO2 level. Through the gas mask, the blood oxygen content is reduced incrementally by changing the oxygen level of the test subject from 100% SpO2 and lowering to 70% SpO2. After collecting enough data according to the FDA regulations, the recorded PPG signals are used to find the R values. Then, a second (or first) order line is fitted to obtain the calibration coefficients a, b, and c for the SpO2 measurement algorithm, as shown in Figure 5.

Figure 5. R-curve based on the collected data from the calibration lab. Each color represents a different test subject.
Maxim’s algorithm outputs the R values. No further effort is required to obtain R from the recorded PPGs. After obtaining the R values with the corresponding reference SpO2 values, it is easy to obtain the calibration coefficients.
Data Collection Protocol
- Select healthy test subjects with different skin color, age, and gender. Increasing the diversity of the test subjects improves the accuracy of the algorithm. We recommend to have 20 different subjects for the calibration procedure.
- Inform each test subject about the protocol details.
- The test subject attaches the Maxim sensor. Make sure that the sensor is correctly attached. For example, if the sensor is in a wrist watch, it should have firm contact but should not be too tight or too loose.
- The test subject lies on the data collection couch. Make sure that the test subject is relaxed.
- On the same hand as the Maxim sensor, attach the finger clips of the reference device(s) to the index or middle finger of the test subject.
- The test subject wears a gas mask. Make sure that the test subject is comfortable.
- Before recording the data, verify the integrity of the test subject’s PPG signals. Make sure that the test subject’s PPG pulses can be clearly observed. Otherwise, tighten, loosen or relocate the Maxim sensor and restart the application in each case until you see clean PPG signals for both red and infrared PPGs.
- Check the DC level of the PPG signals and make sure that the DC levels of the red and infrared PPGs are above 300K for Maxim wrist devices and 150K for Maxim finger devices. Otherwise, tighten, loosen or relocate the Maxim sensor and restart the application in each case until you see DC levels above these levels.
- Before recording the collected data, have the test subject breathe an air mix with rich oxygen to ensure a 100% SpO2 level.
- Start recording the R values using Maxim’s application in calibration mode along with the reference SpO2 data from the reference SpO2 device. Do not stop recording until the protocol ends.
- Starting from a 100% SpO2 level, gradually decrease the oxygen level with 5% steps to 70% SpO2 by letting the test subject breathe an air mix with low oxygen content. Wait at least 30 seconds at each SpO2 level.
- After reaching 70% SpO2, increase the test subject’s SpO2 level to 100% SpO2 by letting the test subject breathe an air mix with rich oxygen.
- Repeat step 11 and step 12 one more time.
- To finish the data collection protocol for the current test subject, stop recording the data and save the log file. Include the date and the test subject’s ID (i.e., name, unique number, etc.) in the file name and remove the equipment from the test subject.

Figure 6. Data collection setup in the calibration lab.

Figure 7. Maxim's sensor placed in a wrist watch. The finger clips of two reference devices are attached to the index and middle fingers of the test subject.
Derivation of SpO2 Calibration Coefficients from Collected Data
- The application records the R values for each second in a file. To align R values and the reference device’s SpO2 values, upsample or downsample the SpO2 output of the reference device to 1 sample/second.
- Make sure that the recorded R values and the reference SpO2 values are correctly aligned as shown in Figure 8. The R values and reference SpO2 values must be negatively correlated.
- During the data collection, SpO2 levels are changed in large steps (~4-6%). Hence, the measured SpO2 levels of the subject may not reach these levels immediately. The transient response between each SpO2 level may mislead the calibration process. For a better calibration, detect the stable and constant SpO2 plateaus as shown in Figure 9.
- Collect the R values and corresponding SpO2 values for the data points inside the stable SpO2 plateaus as shown in Figure 10.
- Obtain the scatter plot of the R values with respect to the reference SpO2 values for all test subjects, as shown in Figure 11. Each color represents a different test subject.
- Before obtaining the SpO2 calibration coefficients, remove the outlier points from the calibration dataset. Perform the following steps for outlier elimination:
- Find the R values that are equal to 100% SpO2.
- Find the mean (µ) and standard deviation (s) of the corresponding R values.
- Remove points that are outside the range of µ± 2s.
- Repeat step a–step c for each SpO2 level (i.e., 100%, 99%, 98%, …, 70%).
- During the data collection, SpO2 levels are changed in large steps (~4-6%). Hence, the measured SpO2 levels of the subject may not reach these levels immediately. The transient response between each SpO2 level may mislead the calibration process. For a better calibration, detect the stable and constant SpO2 plateaus as shown in Figure 9.
- Using regression methods, fit a second (or first) order curve to the collected data. The blue solid line in Figure 9 is the calibration curve after outlier elimination.
- Output the required calibration coefficients a, b, and c. Use these coefficients to measure SpO2 using Maxim’s algorithm, which is expressed as follows:

Figure 8. Reference SpO2 values and output R values.

Figure 9. The stable SpO2 plateaus are shown on the reference SpO2 values.

Figure 10. The stable SpO2 plateaus are shown on the reference SpO2 values and output R values.

Figure 11. Reference SpO2 values with respect to the calculated R values based on the collected data from the calibration lab before outlier elimination.

Figure 12. Reference SpO2 values with respect to the calculated R values based on the collected data from the calibration lab after outlier elimination.

Table 1 shows the default coefficients for the MAX30101 and MAX86140/MAX86141.
| Sensor | Default Calibration Coefficient Without The Optical Shield | ||
| a | b | c | |
| MAX30101 | 1.5958422 | −34.6596622 | 112.6898759 |
| MAX86140/MAX86141 (only for a specific PD-LED separation) | −16.666666 | 8.333333 | 100 |
Leave-One-Out Cross-Validation of Algorithm Performance
- Leave one test subject out of the calibration set for the test set for the calibrated R-curve (or calibration coefficients).
- Repeat the procedure in section Derivation of SpO2 Calibration Coefficients from Collected Data to obtain the calibration coefficients.
- Import the obtained calibration coefficients into the algorithm.
- Estimate the SpO2 level using the recorded R values for the test subject considering only the stable SpO2 plateaus as shown in Figure 10.
- Calculate the RMSE by using the estimated SpO2 and recorded reference SpO2 as shown by the following expression:
- Repeat step 1 – step 5 for each test subject.
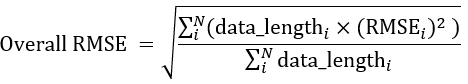
- Calculate the overall RMSE metrics for the algorithm, as shown by the following expression:
- If the overall RMSE is less than 3.5%, use the calibration coefficients obtained with all datasets in the final product. Otherwise, it is recommended to discard the noisy data and outliers and redo the calibration.

Using SpO2 Calibration Coefficients Obtained from the Calibration Lab
When the three calibration coefficients are obtained, they need to be loaded to the MAX32664 through the I2C interface during the initialization process. For more information on the list of commands and initialization instructions, refer to the MAX32664 User Guide[2] and the related application notes for each specific part.
Related to this Article
Product Categories
{{modalTitle}}
{{modalDescription}}
{{dropdownTitle}}
- {{defaultSelectedText}} {{#each projectNames}}
- {{name}} {{/each}} {{#if newProjectText}}
-
 {{newProjectText}}
{{/if}}
{{newProjectText}}
{{/if}}
{{newProjectTitle}}
{{projectNameErrorText}}
Latest Media 21