AN-939: Super-Nyquist Operation of the AD9912 Yields a High RF Output Signal
Introduction
The AD9912 is a DDS-based multipurpose modulator with an integrated 14-bit DAC. The AD9912 is classified as a Nyquist device; it uses a sampling clock to generate its output signal. The result is that the output signal is typically confined to a frequency range between dc and ½ the sampling clock frequency. Often, this frequency limitation is interpreted as a shortcoming. However, a Nyquist device also produces useful signals (spectral images) that extend well beyond the frequency of the sampling clock, thus enabling very high frequency applications.
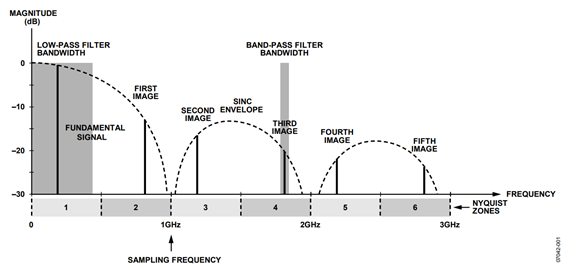
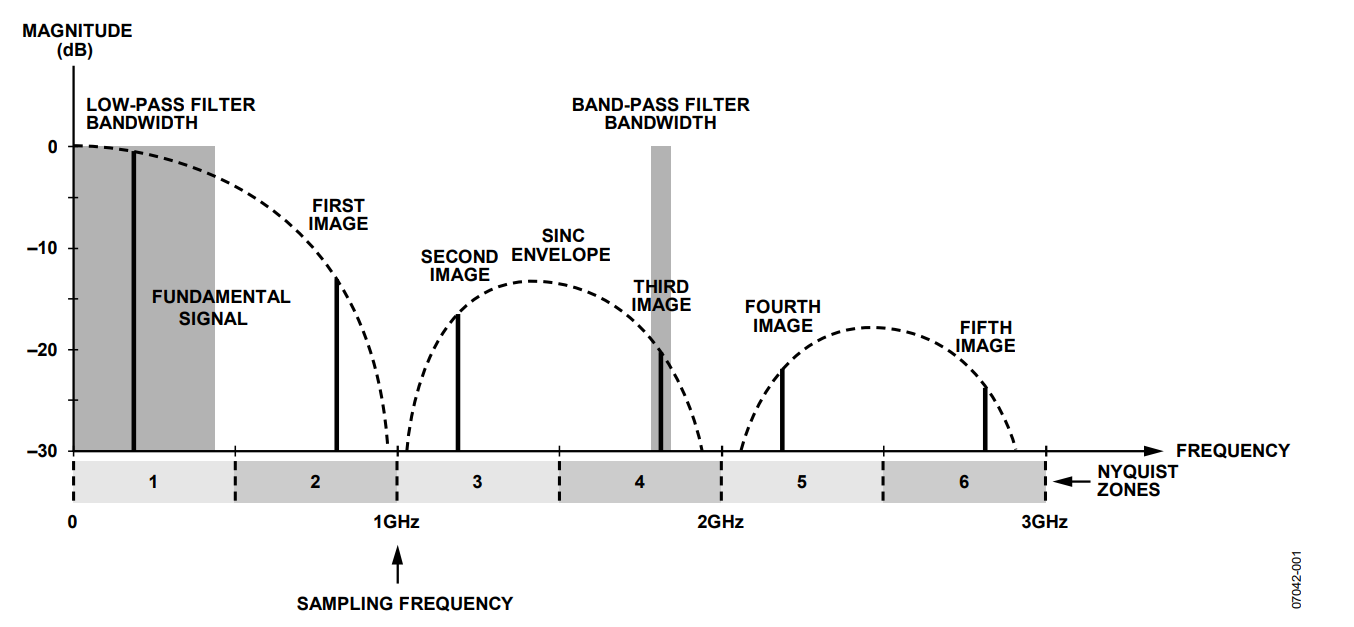
For example, with a 1 GHz sampling clock, the AD9912 can generate a fundamental output signal over a frequency range of dc to 500 MHz. Even though the normal output frequency range is typically limited to 500 MHz, the output signal actually contains useable images of the fundamental signal, out to several gigahertz, as depicted in Figure 1.
The standard approach involves suppressing the images using a low-pass reconstruction filter with a bandwidth of up to ~400 MHz. However, for super-Nyquist operation a band-pass filter is used to select the desired image and reject the unwanted images along with the fundamental. A representation of a typical low-pass and band-pass filter bandwidth appears in Figure 1 for clarity.
Notice that the spectral images exhibit a frequency-dependent attenuation, which is mostly attributed to the well-known sinc response (Figure 1 shows the sinc envelope vertically scaled in decibel units and normalized to 0 dB at 0 Hz). The sinc response is a consequence of the digital-to-analog conversion process of the DAC. In addition to attenuation distortion, images in the even Nyquist zones are spectrally inverted relative to the fundamental signal. Spectral inversion has little impact on a purely sinusoidal DAC output waveform. However, applications that involve a modulated carrier at the DAC output are impacted by spectral inversion (which has the effect of inverting the Q component of an I/Q symbol constellation). In fact, applications involving a modulated carrier can also be affected by the magnitude response of the sinc envelope. The resulting frequency-dependent attenuation can have a negative impact on modulation schemes that require a flat magnitude response over the transmission bandwidth.
Optimizing Super-Nyquist Operation
Although Nyquist images suffer from attenuation due to the sinc response, this does not necessarily preclude their use in high RF applications. This is especially true for applications that can tolerate the reduction in SNR and SFDR that result from the attenuated signal level caused by the sinc envelope. The key to optimizing super-Nyquist operation is to choose the proper sampling frequency, fundamental frequency, and Nyquist zone that put the image relatively close to the peak of the sinc response curve while keeping other spurious artifacts (and images) out of the pass band of the filter. A proper frequency plan can make very high RF applications possible in spite of the limitations often attributed to Nyquist devices.
As a specific example, consider the AD9912 operating with a 1000 MHz sampling clock. A block diagram of the measurement setup is shown in Figure 2.
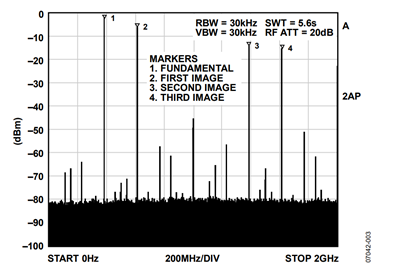
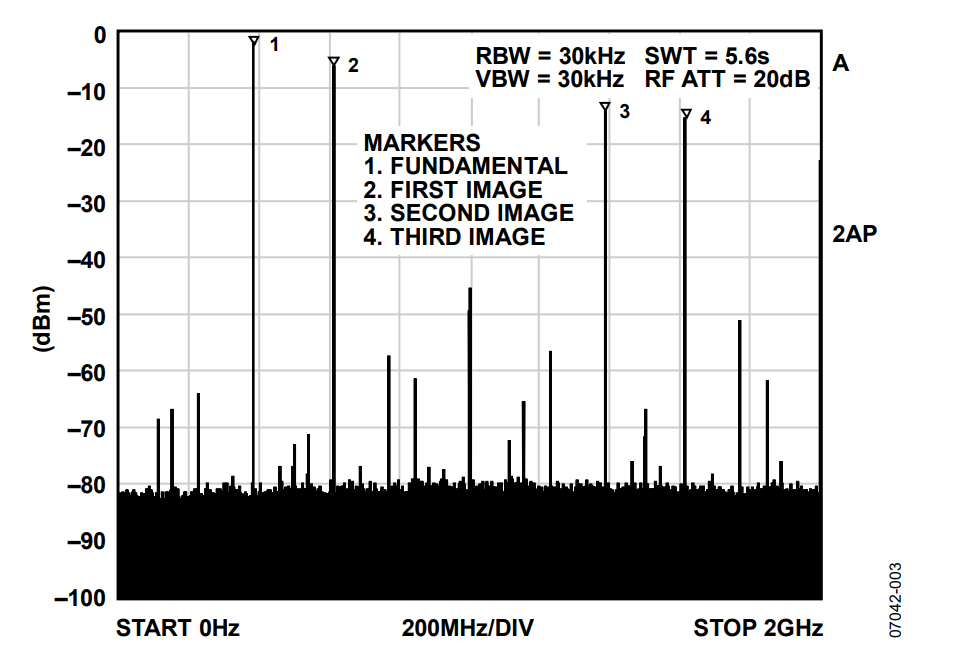
The DDS within the AD9912 is programmed to generate a 385 MHz sinusoid that appears at the output of its integrated 14-bit DAC. The resulting unfiltered output spectrum is shown in Figure 3. This is the spectrum obtained with the SAW filter removed and the spectrum analyzer connected to the output of the balun. In Figure 3, the fundamental signal (385 MHz), the 1st, 2nd, and 3rd Nyquist images (615 MHz, 1385 MHz, and 1615 MHz, respectively) are all clearly visible. It is the 3rd image at 1615 MHz that is used to demonstrate super-Nyquist performance of the AD9912.
Super-Nyquist Operation Using a SAW Filter
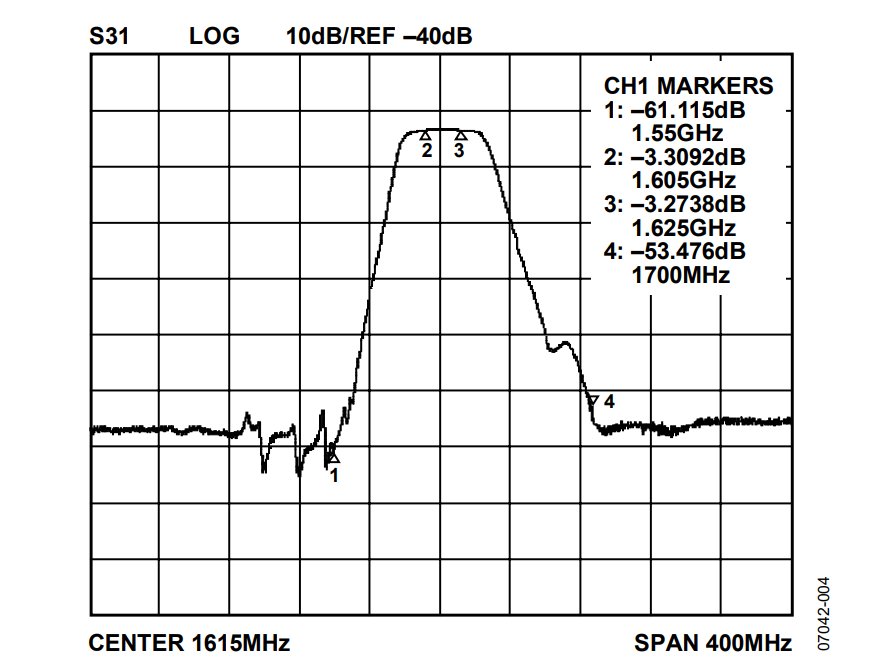
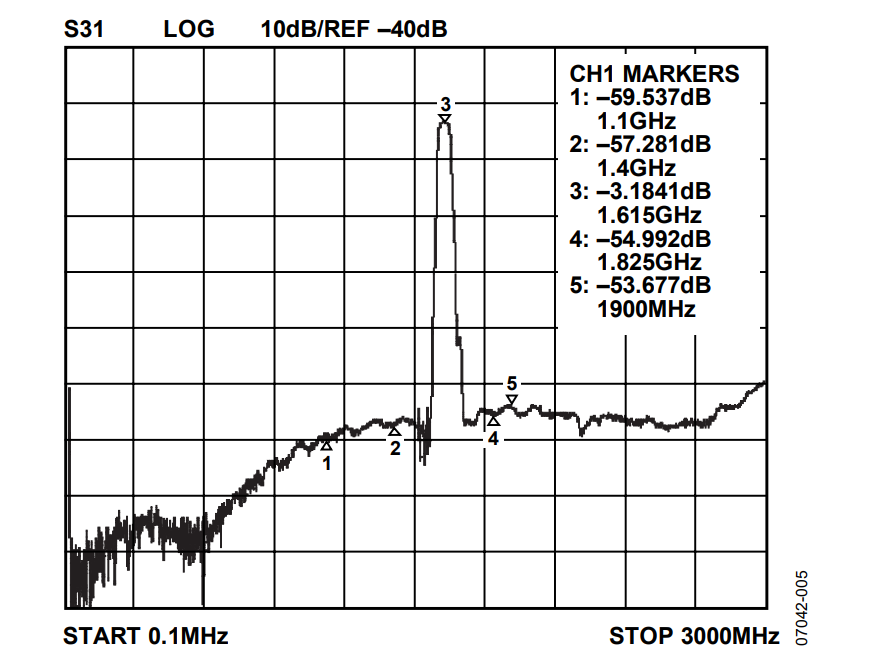
Super-Nyquist operation necessitates the use of a band-pass filter. Furthermore, for the super-Nyquist operation demonstrated in this application note, the target image is of very narrow bandwidth (that is, a single tone at 1615 MHz). Because surface acoustic wave (SAW) filters can provide extremely narrow bandwidths, a SAW filter was the technology of choice for this particular application. The purpose of the SAW filter is to capture the 3rd image with as little additional attenuation as possible, while significantly suppressing the other spurious signals. This demonstration makes use of a Sawtron SAW filter (model STA0528A), which exhibits the frequency response characteristics shown in Figure 4 and Figure 5. It offers a 20 MHz pass band centered at 1615 MHz. The out-of-band response serves to suppress the fundamental signal, the unwanted images, and any other spurious signals contained within the stop band.
SFDR Performance
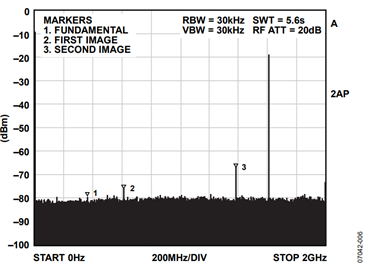
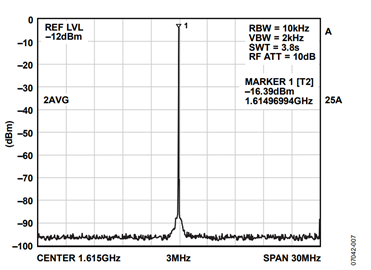
A spectrum of the filtered output is shown in Figure 6. Note the desired image at 1615 MHz, the virtual elimination of the fundamental signal at 385 MHz, and the significant reduction of the undesired images and other spurious artifacts that appeared in the unfiltered spectrum of Figure 3. The worst offender is the 2nd image signal (1385 MHz), which has been suppressed by about 48 dB relative to the 3rd image signal. Because the 3rd image signal (1615 MHz) appears at a frequency that is significantly higher than the 1000 MHz sampling clock, super-Nyquist operation is aptly demonstrated. For completeness, a frequency zoom (30 MHz bandwidth) is shown in Figure 7.
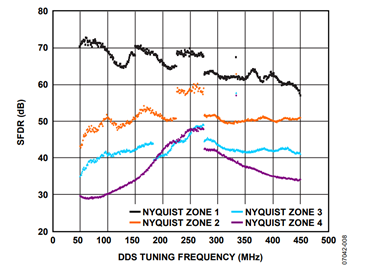
Figure 6 and Figure 7 demonstrate AD9912 SFDR performance for the specific case of the 3rd Nyquist image at 1615 MHz. Figure 8, on the other hand, demonstrates worst-case SFDR performance of the AD9912 over a wide range of DDS tuning frequencies.
Figure 8 contains four traces color-coded by Nyquist zone (see Figure 1 for enumeration of the Nyquist zones). The horizontal axis corresponds to the DDS tuning frequency. There is approximately 1 MHz of horizontal spacing between each of the data points. The data points indicate the typical wideband SFDR performance based on the DDS tuning frequency. The frequency band associated with the wideband SFDR performance at each point is 400 MHz. It spans the indicated Nyquist zone, excluding a 50 MHz keep out region at each end. The keep out region represents 10% of the bandwidth of the Nyquist zone. Furthermore, the SFDR performance at each data point is relative to the magnitude of the image signal in the indicated Nyquist zone.
For example, consider the previously mentioned test case in which the DDS sample rate is 1 GHz with a 385 MHz output signal. In the test case, the 3rd image (located at 1615 MHz) is of interest, which appears in the 4th Nyquist zone. The typical SFDR performance according to Figure 8 is ~36 dB. This is obtained by imagining a vertical line at 385 MHz on the horizontal axis, where it intersects the SFDR trace associated with the 4th Nyquist zone. Then, picture where a horizontal line through this point would intersect the vertical axis.
Note that the test case yields 48 dB SFDR while Figure 8 indicates 36 dB SFDR. The reason for the apparent discrepancy is that Figure 8 indicates the SFDR performance across 80% of the Nyquist bandwidth without the benefit of band-pass filtering. In the test case, however, the SAW filter eliminates most of the offending spurious components. Thus, the results indicated by Figure 8 serve as a conservative guide to worst-case SFDR performance. Clearly, the test case demonstrates that band-pass filtering offers the potential for significant improvement over the SFDR performance of Figure 8.
The traces in Figure 8 exhibit several unusual features that warrant further explanation. First, notice the data points at 333 MHz that exhibit significantly improved SFDR relative to their adjacent data points. This is because 333 MHz happens to fall at ⅓ of the 1 GHz sample rate, which is a unique frequency. A frequency of ⅓ of the sample rate causes the even DAC harmonics (and their Nyquist images) to coincide with the fundamental frequency (and its images). On the other hand, the odd DAC harmonics occur at integer multiples of the sampling frequency. Therefore, the harmonics are either imbedded in the fundamental frequency (and its images) or they are out of band, excluding them from the SFDR measurement in either case. Because DAC harmonics are usually the limiting factor of SFDR performance, their effective disappearance at the fundamental frequency of 333 MHz causes the observed performance improvement.
Another unusual feature of Figure 8 is the pedestal centered at 250 MHz in the traces of both Nyquist Zone 1 and Nyquist Zone 2. The pedestal is caused by the 2nd harmonic crossing into the SFDR keep out region. Because the 2nd harmonic tends to be the limiting factor of SFDR performance in the first two Nyquist zones, its disappearance into the keep out region causes an immediate improvement in SFDR performance.
A third unusual feature of Figure 8 is the pair of discontinuities in the trace of Nyquist Zone 3. At DDS tuning frequencies below 183 MHz, the 2nd harmonic dominates in the 3rd Nyquist zone. At a DDS frequency of 183 MHz, the 3rd harmonic exits the keep out region on the right-hand side of the 3rd Nyquist band and enters the SFDR measurement region. Because of the shape of the sinc envelope in the 3rd Nyquist zone, the magnitude of the 3rd harmonic is at its greatest (within the SFDR measurement band) when the DDS is tuned to 183 MHz. It then becomes the limiting SFDR performance factor resulting in the instantaneous drop at 183 MHz. From this point, the SFDR performance improves as the magnitude of the 3rd harmonic decreases with increasing DDS frequency while the magnitude of the fundamental image increases. At a DDS tuning frequency of approximately 275 MHz, the 2nd harmonic exits the keep out region on the right-hand side of the 3rd Nyquist band and enters the SFDR measurement region. This is the cause of the instantaneous drop at 275 MHz.
The last unusual feature of Figure 8 is the discontinuity in the trace of Nyquist Zone 4 at 275 MHz. At this frequency, the 2nd harmonic exits the keep out region on the left-hand side of the 4th Nyquist band and enters the SFDR measurement region. Because of the shape of the sinc envelope in the 4th Nyquist zone, the magnitude of the the 2nd harmonic is at its greatest (within the SFDR measurement band) when the DDS is tuned to 275 MHz. It then becomes the limiting SFDR performance factor resulting in the instantaneous drop at 275 MHz.
The horizontal axis of Figure 8 denotes the DDS tuning frequency. In the 1st Nyquist zone, the fundamental frequency and the DDS tuning frequency are the same. In the other Nyquist zones, the absolute frequency of the fundamental image and the DDS tuning frequency differ. The location of the image frequency (fimage) is directly related to the DDS tuning frequency (fDDS). The relationship between fimage and fDDS is detailed in Table 1.
| Nyquist Zone | fimage |
| 1 | fDDS |
| 2 | 1 GHz − fDDS |
| 3 | 1 GHz + fDDS |
| 4 | 2 GHz − fDDS |
Conclusion
The AD9912 can be used in applications that call for frequency synthesis beyond the usual Nyquist limit (that is, ½ the sample rate). Its ability to operate at a 1 GHz sample rate provides images that enable certain high RF applications. This application note demonstrates how adequate band-pass filtering enables frequency synthesis at 1.615 GHz and beyond.
