AN-2598: ADRV904x DPD Debug Application Note
Scope
This application note provides assistance in the ADRV904x digital predistortion (DPD) bring-up. This document supplements the information found in the system development user guide. This application note goes through the common debug steps that are encountered during DPD bring-up.
Reference Material
Setup Check
RF Line Up
To tune the DPD, confirm first that the gain/RF line up is correct by checking the power level at each stage of the DPD setup. Figure 1 shows an example of RF line up that is used throughout this document.


Figure 1. Example of RF Line up for DPD.
Ensure that the input power at the power amplifier (PA) does not exceed the maximum rating advised in the PA data sheet, or that the input power at the PA is sufficient. A driver amplifier is necessary to have a sufficient power at the input of the PA that is linearized. In addition, use an isolator between the driver amplifier and the PA, as it enhances gain flatness.
SIMRF
To perform a sanity checking of the gain line up, the Analog Devices, Inc., tool SimRF can be used. This tool can be downloaded at www.analog.com/adisimrf. It allows to easily build the signal chain to visualize signal levels, distortion, and noise. Enter the type of component and their respective parameters for each stage of the signal chain, as shown in Figure 2.


Figure 2. View of the SimRF Tool.
Loopback Path


Figure 3. ORx Capture in ACE.
The ORx attenuation can be digitally adjusted either in the graphical user interface (GUI) in the ORx capture window, see Figure 4, or via the application programming interface (API) adi_adrv904x_Or xAttenSet().


Figure 4. Setting ORx Attenuation in GUI.
Spectrum Analyzer Settings
Adjust the attenuation on the spectrum analyzer that may have an impact on the adjacent channel leakage ratio (ACLR) value. Additionally, noise correction can be turned on if available on the spectrum analyzer.
Tx to ORx Mapping
If the Iteration Count in the DPD Status tab is not updating and there is no Error Code, as shown in Figure 5, then the Tx to ORx mapping must be checked This is to make sure that the profile is aligned with the hardware connection between Tx and ORx. Review the Tx to ORx mapping in ACE in the STREAM SETTINGS tab shown in Figure 6 or in the profile shown in Figure 7. Check that this mapping is considered by using the API adi_adrv904x_TxToOrxMappingGet(), as shown in the following code example:
adi_adrv904x_RxChannels_e orxChannel =
ADI_ADRV904X_ORX0;
adi_adrv904x_TxChannels_e txChannel = 0U;
adi_adrv904x_TxToOrxMappingGet(device, orxChan►
nel, &txChannel);
printf(‘Tx %x mapped to ORx %x’, orxChannel,
txChannel);


Figure 5. DPD Iteration Count Not Updating and Error Code at 0.


Figure 6. Checking the Tx to ORx Mapping in ACE.


Figure 7. Tx to ORx Mapping in the Profile.
For more information about Tx to ORx mapping, refer to AN-2593.
In addition, an error handbook is available at \Adi.Adrv9040.CustomerPkg.X.X.X.X\content\resources\Adi.Adrv9040.CustomerPkg\public\firmware\radio\ADRV9040_FirmwareErrorReference.docx
DPD Optimization
Model Optimization
The generalized memory polynomial (GMP) model consists of a maximum of 255 GMP terms and coefficients, and is user programmable via the GUI (see Figure 8) or the API adi_adrv904x_DpdModelConfigDpdSet().


Figure 8. Loading DPD model in the GUI.
Load Model allows the user to browse for the DPD model path. The fields are automatically populated because of the information in the model header as shown in Figure 8. A DPD model sweep (using the API adi_adrv904x_DpdModelConfigDpdSet()) can be run to find the model that gives the best performance. A bank of models can be provided by Analog Devices upon request.
Refer to the DPD Stability Metrics Characterization section of the ADRV904x System Development User Guide for the device performance evaluation. In addition, the look up table (LUT) depth must be set to a maximum of 32 for frequency division duplex (FDD) and 64 for time division duplex (TDD). The TDD or FDD analog.com mode can be modified in the JSON file by the parameter “is_TDD” as shown in Figure 9. This parameter appears four times in the JSON. These four occurrences can be modified depending on the mode the user wants to apply. Note that the use cases are TDD mode by default.


Figure 9. Switch for TDD or FDD Mode in the JSON.
ACLR Breathing
When ACLR breathing happens, the corrected signal varies in amplitude. This can be caused either by a variation in capture data used for DPD estimation or by a linear term mismatch. Increasing the peak search window size or verify that the linear term, LUT delay, matches the GMP + DDR mode may fix this. The peak search window size can be modified either via GUI or via API to ensure that the highest peak is always captured. In GUI, the peak search window is increased by changing the Window Length parameter in the DPD tab as shown in Figure 10. The Window Length can also be changed via script using the API adi_adrv904x_DpdCaptureConfigSet(), as shown in the following code example:
adi_adrv904x_DfeAppCalDpdCaptureCfg_t dpdCap►
tureCfgSet;
adi_adrv904x_TxChannels_e txChannel =
ADI_ADRV904X_TX0;
dpdCaptureCfgSet.capPeakDetCfg.windowLength =
491520;
adi_adrv904x_DpdCaptureConfigSet(device,
txChannel, dpdCaptureCfgSet);


Figure 10. Modifying Peak Search Window in the GUI.
Indirect/Direct Learning
The ADRV904x DPD algorithm supports both indirect learning and direct learning DPD mechanisms for extracting DPD model coefficients that can impact the DPD performance. Refer to the ADRV904x System Development User Guide for more details. To switch between direct and indirect learning, use either the GUI in the DPD tracking configuration window or the API adi_adrv904x_DpdTrackingConfigSet(). Following is an example of the API adi_adrv904x_DpdTrackingConfigSet():.
adi_adrv904x_DfeAppCalDpdTrackCfg_t
dpdTrackCfg;
dpdTrackCfg.forceDirect = 1; #1 for direct
learning, 0 for indirect learning
dpdTrackCfg.filterCoef = Array[Int16]([])
adi_adrv904x_DpdTrackingConfigSet(device,
TxchannelMask, dpdTrackCfg);
Regularization Value
To improve DPD stability, tune the DPD regularization. DPD regularization is used to make the DPD coefficient estimation less sensitive to missing data and prevent over fitting. See Figure 11 to modify the direct regularization value in the GUI or the following code example to modify it via API:
adi_adrv904x_DfeAppCalDpdTrackCfg_t
dpdTrackCfg;
uint32_t TxChannelMask = 0x01;
dpdTrackCfg.directRegValue = 30;
adi_adrv904x_DpdTrackingConfigSet(device,
TxchannelMask, dpdTrackCfg);


Figure 11. Modifying Direct Regularization Value in the GUI.
Feature Filtering
Although the DPD actuator rate can run up to 2GHz that allows 5× oversampling for a 400MHz instantaneous bandwidth (IBW), the transmit and observation paths may have lower bandwidth. As a result of the limited bandwidth, the higher order terms digitally fold back, and feature filtering allows to avoid the compensation of these terms by the DPD actuator, as they are filtered out by the lower BW analog path and not present after the PA. The filter can be enabled and the coefficients are loaded through the GUI in the DPD tracking window as shown in Figure 12 or via the API adi_adrv904x_DpdTrackingConfigSet() as shown in the following code example:
adi_adrv904x_DfeAppCalDpdTrackCfg_t
dpdTrackCfg;
dpdTrackCfg.adapt.featureFilterEn = 1;
dpdTrackCfg.filterCoef = Array[Int16]([])
adi_adrv904x_DpdTrackingConfigSet(device,
TxchannelMask, dpdTrackCfg);


Figure 12. Enabling Feature Filtering in the GUI.
| Issue | Likely Cause | Possible Solution |
| Poor ACLR | Saturation of the ORx ADC due to input power exceeding the ORx maximum input power Low ORx power |
Add RF attenuation on the RF line up Adjust the ORx digital attenuation via API or GUI See the Loopback Path section |
| DPD update count stuck at 0 | Tx to ORx mapping issue | Review Tx to ORx mapping (see the Tx to ORx Mapping section) |
| ACLR breathing |
Variation in capture data used for DPD estimation |
Increase peak search window to ensure that the highest peak is always captured Verify that the linear term LUT delay matches the GMP + DDR mode See the ACLR Breathing section |
| ACLR gradually deviating with time |
Divergence from direct learning mechanism |
Switch to indirect learning if performance is not a bottleneck Increase regularization value See the Indirect/Direct Learning section and the Regularization Value section |
| Poor ACLR performance with symmetric carriers | Intermodulation products folding back into band of interest | Enable feature filtering (see the Feature Filtering section) |
Example Case Study
In this section, an example case is studied that allows to see the impact of what has been mentioned in the previous sections on the ACLR. The signal chain used for the example case is the one shown in Figure 1, and a picture of the setup is shown in Figure 13.


Figure 13. Picture of the Signal Chain for DPD.
A first look at the ACLR is shown in Figure 14, where approximately −32dBc ACLR is obtained. In that case, it is recommended to break down the gain line up, by looking at the output of the driver amplifier. The ACLR at the output of the driver amplifier is about −38dBc, as shown in Figure 15, whereas the ACLR is expected to be about −60dBc as this driver amplifier is supposed to operate in its linear region. The root cause of this poor ACLR is a large attenuation on the spectrum analyzer, and when changing the spectrum analyzer attenuation from +24dB to +6dB, the ACLR jumps from −38dBc to −54dBc, as shown in Figure 16.


Figure 14. First Look at the ACLR.


Figure 15. ACLR at the Output of the Driver Amplifier.

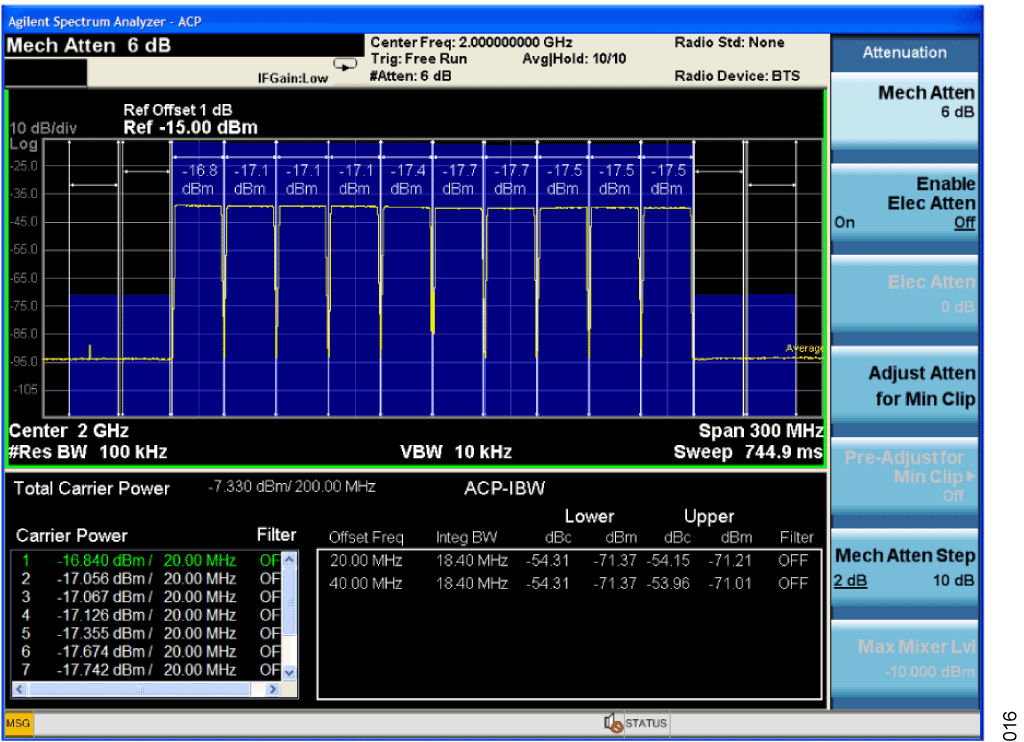
Figure 16. ACLR at the Output of the Driver Amplifier After Adjusting the Spectrum Analyzer Attenuation.
To get closer to the −60dBc ACLR target, the noise correction of the spectrum analyzer can be turned on and its effect is shown in Figure 17, allowing the ACLR to reach −59dBc ACLR.


Figure 17. ACLR at the Output of the Driver Amplifier After Turning the Noise Correction On.
The power at the ORx port must be checked. An easy way to reduce the attenuation at the ORx port is to swap the ORx from the coupled port of the splitter to the forward port, and adjust the ORx attenuation if needed, as detailed earlier in the Loopback Path section. The Mean ORx Power and the Peak ORx Power can be seen in the DPD window under DPD Statistics as shown in Figure 18. The impact on the ACLR is shown in Figure 19, jumping from −38dBc to −42dBc.


Figure 18. SNR Improvement of the ORx Path by Adjusting ORx Attenuation.


Figure 19. Impact of the ORx Level Adjustment on the ACLR.
As mentioned in the Model Optimization section, the coefficients of the GMP terms are user programmable, and a bank of models is available upon request. Using the right model in this case makes the ACLR jump to −48dBc (see Figure 20).


Figure 20. ACLR Performance After Using the Right Model.
To reach the +50dBc ACLR target, the direct learning mode can be used because this algorithm is more accurate, even though it requires a longer time to converge compared to indirect learning. The ACLR performance improvement using direct learning is about +2dB, and allows to reach −50dBc in this case, as shown in Figure 21.


Figure 21. ACLR Performance After Using Direct Learning.