Abstract
Does a resistance temperature detector (RTD) temperature measurement system have consistent errors? Can a high precision RTD temperature measurement system be designed without the need for calibration? This article presents a high precision RTD temperature measurement system, which uses error compensation to achieve an accuracy of ±0.15°C within a range of –25°C to +140°C without the need for calibration.
Introduction
The precondition for error compensation is the consistency of errors in the temperature measurement system. This article will introduce the theoretical error calculation method for the RTD temperature measurement system and attempt to minimize error sources as much as possible. Then, different temperature values within the range of –25°C to +140°C are selected to measure the error of the RTD temperature measuring system. Based on the consistency of the temperature measurement error curve of different measurement channels, the fitting function expression of the error curve is found and used to compensate for the error of the temperature measurement system. The effectiveness of this method in improving the accuracy of the temperature measuring system is verified. The error over the entire range is significantly reduced from –0.8°C to +0.2°C to –0.15°C to +0.15°C. Finally, the measured noise and error of the temperature measuring system are presented.
RTD Selection
Temperature sensors are a significant part of temperature measurement systems as they convert temperature signals into electrical signals to enable temperature measurement. Common types of temperature sensors include thermocouples, RTDs, thermistors, and IC temperature sensors.
Among them, RTD has several advantages such as good linearity, wide temperature measurement range, high accuracy, and good stability, which make it widely used in temperature measurement applications.
Manufacturers of RTDs include TE Connectivity, Heraeus, Honeywell, and others. Most RTD manufacturers produce RTDs that conform to the IEC 60751 standard, which divides platinum RTDs into four accuracy classes: AA, A, B, and C. When selecting an RTD, factors such as the temperature measurement range, tolerance, and cost should be considered comprehensively. TE Connectivity’s PTF series includes a range of RTDs made from platinum resistors using the latest thin film technology. Table 1 presents the measurement ranges, tolerances, and costs of these RTDs.
| RTD Class | Range | Tolerance at T°C |
| AA | –30°C to +200°C | Z±(0.10 + 0.0017 × |T|) |
| A | –30°C to +300°C | ±(0.15 + 0.002 × |T|) |
| B | –50°C to +600°C | ±(0.30 + 0.005 × |T|) |
| C | –50°C to +600°C | ±(0.60 + 0.06 × |T|) |
As shown in Table 1, the tolerance of RTDs increases step by step as the grade changes, and the higher the grade, the smaller the tolerance. After a comprehensive analysis, it is found that Class B RTD has a wide temperature measurement range, and its tolerance is small enough to meet the needs of most industrial applications. Moreover, the cost of Class B RTDs is relatively inexpensive. Therefore, a Class B RTD with the model PTFD101B1A0 is selected as the temperature sensor used in this article.
Resistance-Temperature Characteristic Curve of Pt100
The German standard DIN EN 60751 stipulates the relationship between resistance and temperature of Pt100, as shown in Figure 1. The resistance of a Pt100 RTD is 100 Ω at 0°C, and its temperature coefficient is 0.385 Ω/°C over a certain temperature range.


The resistance-temperature conversion relationship of the PTF series also follows the DIN EN 60751 standard. The Callendar-Van Dusen formula accurately describes the transfer function between the resistance value and temperature of Pt100.


When the temperature is T ≥ 0°C, the transfer function is shown in Equation 1.

When the temperature is T < 0°C, the transfer function is shown in Equation 2.

where
T ithe RTD temperature (°C)
R (T) is the RTD resistance at temperature T
R0 is the RTD resistance at 0°C

To calculate the temperature being measured based on the resistance value of the RTD, the inverse function of the transfer function needs to be derived. In this article, the following formula will be used for calculation:
When R ≥ 100 Ω, the equation is

When R < 100 Ω, a fifth-order polynomial fit will be used for calculation:

where
T(R) is the temperature of RTD.
R is the resistance of RTD at T °C and the other variables are as defined previously.
Reference Circuit and ADC Configuration
To achieve high precision temperature measurement, it is not only necessary to select sensors with small errors but also to design precise signal conditioning circuits. In this article, we chose the AD7124-8, which is suitable for high precision temperature measurement applications, and configured it appropriately to eliminate sources of error in the signal chain as much as possible.
Choosing the Value of Excitation Current
Generally speaking, the larger the excitation current, the higher the sensitivity of temperature measurement, thus improving the temperature measurement performance. However, a larger excitation current is not always better. On the one hand, the thermal power generated by the excitation current on the RTD is proportional to the square of the current, and the larger the current, the greater the self-heating effect, which may have a significant impact on temperature measurement. On the other hand, it is limited by the compliance voltage of the current source. Therefore, when choosing the value of the excitation current, it is necessary to take into account both the self-heating effect and the compliance voltage.
Figure 3 shows the temperature drift caused by self-heating effects with current values of 250 μA, 500 μA, and 1000 μA. The horizontal axis represents time in seconds, while the vertical axis represents the temperature drift caused by self-heating effects in degrees Celsius. The different colors represent different current values, where blue represents 250 μA, red represents 500 μA, and green represents 1000 μA. Each color has three lines representing the results of three different temperature measurement channels with the same current value. It can be observed that the larger the excitation current, the greater the temperature drift caused by self-heating effects.


After conducting a controlled experiment on the excitation current, the excitation current is set to 250 μA to eliminate the influence of self-heating on the measurement results.
The compliance voltage refers to the minimum voltage required for a nonideal current source to maintain a constant current output. If the voltage is below this value, the current source cannot maintain its output and becomes ineffective. The compliance voltage of the current source inside the AD7124-8 is 370 mV when the output current is set to 250 μA. Therefore, the voltage at the output pin of the current source cannot exceed AVDD-0.37 V, where AVDD is 3.3 V. As a result, the selection of the external resistor value must satisfy the following conditions:

Where, RMAX is the maximum resistance value within the temperature measurement range.
Ratiometric Measurement
By consulting the data sheet of the AD7124-8, it can be found that the typical value of the error of the internal integrated current source is ±4%. If a common-voltage reference source is used as the reference voltage for the ADC, the current source may cause a gain error of ±4%. In the application described in this article, this will result in a temperature measurement error of approximately 10.4°C (100 × 4%/0.385 = 10.4°C) in the worst case. However, using a ratiometric measurement method will completely eliminate the error caused by this error source.
Selection of Reference Resistors
The temperature measurement range of PTFD101B1A0 is –50°C to +600°C. According to the Callendar-Van Dusen equation, the corresponding RTD resistance values are approximately 80.3 Ω to 313.7 Ω. Therefore, the nominal resistance value of the reference resistor must be greater than 313.7 Ω to measure the full range. The data sheet specifies that the input range of the external reference voltage must be greater than 0.5 V and less than AVDD. Therefore, 0.5 V < I × RREF < 3.3 V, but it is also important to note that RREF should not be too large and exceed the compliance voltage limit in Equation 5.
The ADC reference voltage is generated by the current flowing through the reference resistor. After the gain error caused by the current source is eliminated by ratiometric measurement, the error of the reference voltage is only contributed by the tolerance and temperature coefficient of the reference resistor, which will ultimately result in temperature measurement error.
In summary, choosing the RG1608V-392-P-T1 resistor manufactured by Susumu with a tolerance of only ±0.02%, and a nominal resistance value of 3.9 kΩ, and a temperature coefficient of only ±25 ppm/°C. In the application described in this article, the temperature measurement error caused by its tolerance is only 0.052°C in the worst case, calculated as 100 × 0.02%/0.385.
4-Wire RTD Configuration
RTD is sometimes used for long-distance temperature measurement. The lead resistance of the long metal wire cannot be ignored, which results in temperature measurement errors in the system. Currently, there are three types of wiring configurations: two-wire, three-wire, and four-wire. Among them, the four-wire connection method has the smallest error. As shown in Figure 2, RL1 through RL4 are lead resistances. The idea of the four-wire method is to use two wires (RL1 and RL4) to carry the excitation current, while the other two wires (RL2 and RL3) are connected to the high impedance measuring end to measure the voltage across the RTD. Since the measuring end has a very high input impedance, almost no current flows through the lead on the measuring end, and the I × R voltage formed by the lead resistance is almost zero, thus eliminating the error caused by the lead resistance. If the two-wire method is used, the nominal resistance of 24 AWG copper wire is 0.08 Ω/meter. If the RTD has leads with a length of 1 m, it has a total lead resistance equivalent to 0.16 Ω. The RTD temperature coefficient is approximately 0.385 Ω/°C. Therefore, 0.16 Ω lead resistance produces an error of (0.16/0.385) = 0.42°C error due to lead resistance.
This article adopts the four-wire RTD configuration method and allows multiple RTDs to share a reference resistor. An AD7124-8 can connect up to five four-wire RTDs. In this article, each AD7124-8 device is connected to three four-wire RTDs, which give the system three temperature measurement channels. In multichannel applications, the three channels are time-division multiplexed, and the output pins of the current sources and the differential analog input pins corresponding to each channel are shown in Table 2.
| Channel | IOUT0 | AIN+ | AIN– |
| CH0 | AIN0 | AIN2 | AIN3 |
| CH1 | AIN1 | AIN4 | AIN5 |
| CH2 | AIN8 | AIN6 | AIN7 |
Headroom Resistor
If the reference voltage buffer is enabled, the limit of the input voltage to the rail should be considered. After the buffer is enabled, the absolute voltage input range of the reference voltage input terminal is AVSS 0.1 V to AVDD to 0.1 V. If one end of the reference resistance is directly grounded, the voltage at the REFIN1-pin will be equal to AVSS, which exceeds the allowable input range. Therefore, a headroom resistor is added whose resistance must be greater than 0.1 V/250 μA = 400 Ω. In this article, 510 Ω is chosen as the resistance value of the headroom resistor, which provides sufficient margin while also not violating the compliance voltage requirements.
Gain Selection
In addition to measurement errors caused by peripheral circuitry, there are also error sources inside the ADC that can cause certain errors.
The AD7124-8 integrates a PGA internally, which can be used to amplify the input signal with different gains, thus fully utilizing the large dynamic range of the ADC and reducing the measurement uncertainty caused by quantization noise. However, the PGA also has gain error that can be seen in the data sheet. When gain = 1 and the PGA is not enabled, the maximum gain error is only ±0.0025% because each AD7124-8 undergoes gain calibration in factory. However, once gain > 1 and the PGA is enabled, the typical gain error reaches –0.3%, so internal gain calibration must be performed to reduce the unbearable gain error caused by PGA. When the gain is set to 2, 4, or 8, the maximum gain error after calibration is ±0.016%, which is about ten times larger than the error at gain = 1. Of course, gain selection not only changes the gain error, but also the integral nonlinearity. The article uses a gain = 1 configuration because the measurement error caused by quantization noise is smaller than the gain error after calibration at gain > 1.
Digital Filter
The sinc4 filter and the output data rate of 10 SPS are selected in this article for the following reasons.
Choosing the sinc4 filter with a data output rate of 10 SPS has the advantage that the sinc filter has extremely high attenuation at the multiples of the data output rate, and another consideration is the effective value of noise. Under the conditions of full power mode, gain = 1, output data rate of 10 SPS, and a sinc4 filter, the rms noise value is 0.23 μV and peak-to-peak noise is 1.5 μV. The peak-to-peak resolution is 21.7 bits, which is converted to 1.5 μV/250 μA/0.385 (Ω/°C) = 0.0156°C in temperature measurement. The actual temperature noise during measurement is shown in Figure 4.


Internal Calibration
The AD7124-8 has an internal calibration function that can greatly reduce the gain and offset error of the ADC. Since the AD7124-8 undergoes gain calibration at gain = 1 in factory, the ADC does not support internal gain calibration when gain = 1 is selected. Therefore, for gain error, this article does not perform internal gain calibration but directly uses the performance after factory gain calibration at gain = 1.
After power-on reset, the system will carry out internal offset calibration of the AD7124-8 each time to reduce the offset error. In this way, the offset error and its temperature drift can be reduced to the noise range. The typical offset error of AD7124-8 is ±15 μV, which is converted to 15 μV/gain = 1/250 μA/0.385 = 0.156°C in temperature measurement. After the internal offset calibration, the worst-case offset error is about half of the peak-to-peak noise value, resulting in an error of only about 0.008°C in temperature measurement.
Summary of Systematic Error Analysis
| Source of Error | Optimization | Max Error at 0°C |
| RTD sensor | Low tolerance | ±0.3°C |
| Current source | Ratiometric measurement | 0°C |
| Reference resistor | Low tolerance Low temperature drift |
±0.052°C |
| Lead resistance | 4-wire connection | 0°C |
| Offset error | Internal offset calibration | ±0.008°C |
| Gain error | Gain = 1 configuration | ±0.006°C |
| Integral nonlinearity | Gain = 1 configuration | ±0.040°C |
| Quantization noise | Full power mode 10 SPS Sinc4 | ±0.008°C |
| Self-heating effect | 250 μA excitation current | — |
| Total | — | ±0.414°C |
Test Plan for Error Analysis Test Equipment
After calculating the theoretical performance of the system, it is necessary to verify the actual performance of the system through measurement. For a temperature measurement system, the most important performance specification is the error between the measured temperature value and the true temperature value. Therefore, in order to measure this specification, a precise and wide-range temperature source is needed. Fluke Calibration has rich experience in temperature calibration, and its products have provided reliable standards for various temperature measurement scenarios.
Fluke’s 7109A portable calibration bath can heat or cool the liquid inside the bath, with a controlled temperature output range of –25°C to +140°C and an accuracy of ±0.1°C. Compared to ±0.414°C, ±0.1°C cannot be ignored. Therefore, we need a more precise thermometer together with the 7109A to form a more precise source. The Fluke’s temperature measurement system, composed of the platinum resistance thermometer 5615-12 and the portable thermometer 1529 can achieve an accuracy of ±0.012°C at 0°C after being calibrated. In subsequent experiments, Fluke’s temperature measurement system serves as the standard, and its readings are considered as the true temperature values of the measured liquid.
It is worth noting that the temperature field of the liquid in the thermostat is not isothermal. According to the technical specifications of the 7109A, the typical value of its uniformity is 0.02°C, which means that the maximum temperature difference between any two points in the thermostat at the same time is 0.02°C. This may cause errors in repeat experiments because it is not possible to place the temperature sensor in exactly the same position as the previous experiment.
Test Method
Place the platinum resistance thermometer and the RTD selected in this article in the thermostat, set the thermostat to a certain fixed temperature value and wait for the temperature to stabilize. The values of both the Fluke temperature measurement system and the AD7124-8 temperature measurement system are recorded at the same time. The reading of the system is taken as the true value, and the reading of the AD7124-8 temperature measurement system is taken as the measured value. Subtract the two values to obtain the actual temperature measurement error of the AD7124-8 temperature measurement system, as shown in Equation 6.

where:
Tmeasured is the reading of the AD7124-8 temperature measurement system.
Ttrue is the reading of the Fluke temperature measurement system.
error[T] is the actual temperature measurement error of the AD7124-8 temperature measurement system at T°C.
The set temperature values below zero degrees are selected as –25°C, –20°C, –15°C, –10°C, –5°C, 0°C, while the set temperature values above zero degrees are selected as 0°C, 10°C, 25°C, 37°C, 55°C, 70°C, 85°C, 100°C, 120°C, and 140°C.
When the temperature is below zero, the liquid used in the thermostat is industrial alcohol with a purity of 99%, because the freezing point of alcohol is relatively low. When the temperature is above zero, the liquid used in the thermostat is silicone oil, because the alcohol is volatile and can easily cause safety accidents.
RTD Probe
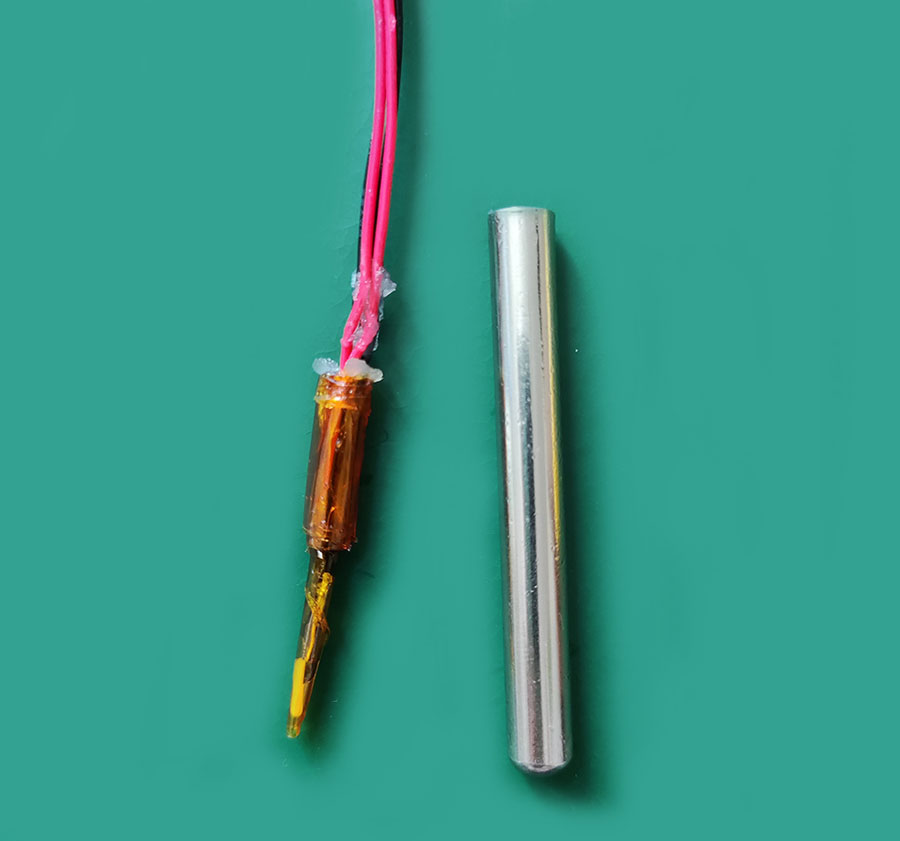
An exposed RTD is susceptible to various substances in the environment, and it has poor waterproof and dustproof ability. Notably, water can seriously affect the resistance value of RTD. Therefore, it is necessary to design a waterproof package for RTD.
This article has made a simple stainless steel probe to protect the RTD, as shown in Figure 5. The manufacturing method is to put the RTD into a stainless steel sleeve, then fill the opening of the sleeve with silicone gel. After the silicone gel solidifies, it can be placed in the thermostat for temperature measurement. This method is not an excellent waterproof solution, it is only used during the experiment. In practical applications, RTD waterproofing must be an essential design content that designers cannot ignore.

It is worth noting that in high temperatures exceeding 670°C, the stainless steel probe will release metal ions that can pollute the high purity platinum, causing the RTD resistance value to change. Therefore, for high temperature measurement applications, RTD should be protected by probes made of quartz glass or platinum. These materials can maintain inertness at high temperatures, and the RTD can remain free from contamination.
Test Results
This test totally adopts 14 RTDS PTFD101B1A0 numbered RTD1 through RTD14, which are randomly combined with three AD7124-8 devices and connected to the signal input terminal of each AD7124-8’s EVB circuit board according to Table 4. Then, the RTD probes are placed in the thermostat at different temperature values for temperature measurement, and the temperature measured values are compared with the true values.
| RTD Number | EVB Number | ADC Channel |
| RTD1 | EVB1 | CH0 |
| RTD2 | EVB1 | CH1 |
| RTD3 | EVB1 | CH2 |
| RTD4 | EVB2 | CH0 |
| RTD5 | EVB2 | CH1 |
| RTD6 | EVB2 | CH2 |
| RTD7 | EVB3 | CH0 |
| RTD8 | EVB3 | CH1 |
| RTD9 | EVB3 | CH2 |
| RTD10 | EVB1 | CH0 |
| RTD11 | EVB1 | CH1 |
| RTD12 | EVB1 | CH2 |
| RTD13 | EVB2 | CH0 |
| RTD14 | EVB2 | CH1 |
The errors of multiple temperature values are combined to obtain the error curve of the temperature measurement system within –25°C to +140°C. Figure 6 and Figure 7 respectively show the error curves of temperature above zero and below zero for 14 temperature measurement channels.


The horizontal axis in the figure represents the temperature set by the thermostat in °C, and the vertical axis represents the measurement error in °C. It is apparent that regardless of the temperature being below or above 0°C, the 14 RTD temperature measurement channels correspond to 14 error curves that have consistent variation patterns. Therefore, the data obtained from actual test can be curve-fitted to obtain the error function error [T] of the AD7124-8 temperature measurement system. If this function expression can have a certain error compensation effect on AD7124-8 temperature measurement systems produced by the same process, then using the function directly in the program for error compensation can save the calibration process in production and greatly improve the performance of the temperature measurement system relative to the uncalibrated situation.
Curve Fitting
Although the temperature measurement error curves of 14 RTD measurement channels have a consistent trend, their slopes and intercepts differ to some extent due to variations in the production. To provide error compensation for all RTD measurement channels produced by this process, it is necessary to find the middle curve of the area surrounded by the 14 temperature measurement error curves. It would be more appropriate to describe the error function using a piece-wise function, divided into two sections: above zero and below zero.
First, observe the temperature measurement error curve above zero. The change in temperature measurement error between 0°C and 140°C is a curve that is close to a quadratic function error (T) = AT2 + BT + C (T > 0).
This article chooses the average value of the third largest and third smallest error values at 0°C as the constant term C value of the error function. The reason for choosing the error at 0°C is that the resistance value of RTD at 0°C is its nominal resistance value. The reason for not choosing the two RTD measurement channels with the maximum and minimum errors is that they are more likely to be defective. The second largest and second smallest error values may also have specificity. Therefore, the third largest and third smallest error values are chosen. It is believed that most of the good products will fall within the error range (–0.04680°C, +0.08392°C) surrounded by the third largest and third smallest error values. Therefore, taking the midpoint 0.01855°C as compensation can optimize the performance of most good products within an error range of ±0.06537°C at 0°C.
The coefficients A and B are obtained through curve fitting, as shown in Figure 8. The discrete points used in curve fitting are the average of 14 error values measured at each fixed temperature value. There are 10 fixed temperature values above zero, so the curve fitting is based on the best fit of these 10 discrete points, and the correlation coefficient R2 of the curve fitting reaches 0.9989. Finally, the error function above zero is determined to be Equation 7.


Observe the temperature measurement error curve below zero. It can be seen that the temperature error does not change with the temperature between –25°C and 0°C. Therefore, the error curve below zero is a function close to a constant error [T] = D (T < 0). Similarly, the value of D in the error function is determined as the average of the third largest and the third smallest error values at 0°C. Finally, the error function below zero is determined to be Equation 8.

Accuracy Improvement After Error Compensation
After the error function is obtained, we use it in the microcontroller program to compensate for the temperature measured value. When we get the binary data converted by ADC, we calculate the Tmeasured by equations 3 and 4, and then compensate for the error using Equation 8. In other words, we use the same error function to calibrate all RTD temperature measurement channels, which is a time-saving and accuracy-enhancing calibration method that compensates for errors across the entire measurement range.

where:
T’measured is the measurement value after error compensation, and the other variables are defined previously.
Finally, we need to verify if the compensation using the error function is effective. By subtracting the compensated measurement value from the true value, we can obtain the measurement error after compensation, as shown in Equation 10.

where:
error’ [T] is the error after error compensation at T(°C) and the other variables are as defined previously.
We selected nine RTDs and three AD7124-8 devices to form 9 RTD temperature measurement channels according to the combination method shown in Table 5. The RTDs are placed in the thermostat, and the same fixed temperature value above zero is selected for temperature measurement as before.
| RTD Number | EVB Number | ADC Channel |
| RTD1 | EVB1 | CH0 |
| RTD2 | EVB1 | CH1 |
| RTD3 | EVB1 | CH2 |
| RTD4 | EVB2 | CH0 |
| RTD5 | EVB2 | CH1 |
| RTD6 | EVB2 | CH2 |
| RTD7 | EVB3 | CH0 |
| RTD8 | EVB3 | CH1 |
| RTD9 | EVB3 | CH2 |
We observe the compensation effect of temperature measurement errors in the range above zero. The initial temperature measurement errors and the errors after compensation are respectively shown in figures 9 and 10.


The results shown in the figure indicate that when the temperature is in the range of 0°C to 140°C, error compensation can reduce the temperature measurement error from –0.8°C to +0.2°C to –0.3°C to +0.15°C within this temperature range.
Then, observe the temperature measurement error compensation effect of temperature range below zero, and select the same fixed subzero temperature value for temperature measurement. The initial temperature measurement error and the compensated temperature measurement error are shown in Figure 11 and Figure 12 respectively.


The results shown in the figure indicate that when the measured temperature is within the range of –25°C to 0°C, error compensation can change the error range from –0.1°C to +0.15°C to –0.15°C to +0.1°C.
In conclusion, within the temperature range of –25°C to +140°C, the temperature measurement errors can be kept within ±0.3°C after compensating with the error function, and 8 out of 9 RTD temperature measurement channels can maintain a temperature measurement error within ±0.15°C in the temperature range of –25°C to +140°C, significantly improving the temperature measurement accuracy.
Introduction of New Products
Based on the AD7124-8, ADI has developed a new-generation chip AD4130-8, which features ultra low power consumption and small size. As shown in the data sheet, when the internal oscillator and internal reference are enabled, the typical power consumption in continuous conversion mode with PGA gain = 1 to 16 is 35 μA. In the mode with a duty cycle ratio of 1/4, the typical power consumption drops to 11 μA, and in the mode with a duty cycle ratio of 1/16, the typical power consumption drops to only 4.35 μA. Such strong performance can be achieved in a WLCSP package with a size of only 3.6 mm × 2.74 mm.
Similarly, the AD4130-8 is also suitable for temperature measurement, so we insert RTD9 into the AD4130-8 EVB board to form a temperature measurement channel. The AD4130-8 is configured as 10 SPS, sinc3 digital filters, full power mode, PGA gain = 1, and excitation current = 200 μA, and it enables the analog input buffer and reference voltage buffer.
The noise performance of the AD4130-8 temperature measurement system is tested. We recorded 100 temperature data samples at a rate of 10 SPS for a duration of 10 seconds. The results are shown in Figure 13.


As shown in Figure 13, the peak-to-peak noise value in 100 samples measured by the AD4130-8 under the aforementioned configuration is 0.04°C. This value is slightly larger than that of the AD7124-8, but it comes with a significant reduction in power consumption.
In addition, the temperature measurement error of the AD4130-8 temperature measurement system is measured. Place the RTD9 in the thermostat, select 15 fixed temperature values as before in the range of –25°C to +140°C, and record the temperature measurement error of the RTD temperature measurement channel at each temperature. Moreover, we compare the results with the temperature measurement error curve obtained from the temperature measurement channel formed by the RTD9 and AD7124-8. The results are shown in Figure 14.
As shown in the figure, the temperature measurement error of the AD4130-8 system is not significantly different from that of the AD7124-8 system in the temperature range of –25°C to +140°C.


Conclusion
In this article, we selected the PTFD101B1A0 RTD temperature sensor and combined it with the sigma-delta (Σ-Δ) ADC AD7124-8 to form a temperature measurement system with the goal of minimizing error sources. The optimized configuration of the chip and its peripheral devices were detailed. And the excellent performance of the temperature measurement system designed in this article was demonstrated through actual tests: no calibration process was required during the manufacturing process; the measured temperature error can be maintained within ±0.3°C in the temperature range of –25°C to +140°C, and the typical value of temperature measurement error is about ±0.15°C. Choosing high cost-effective RTD, ADC, and peripheral devices makes the entire temperature measurement solution cost-effective, while maintaining high accuracy.
With its exceptional temperature measurement capabilities, ultra low power consumption, and compact size, the AD4130-8 is suitable for a wide range of applications and market opportunities.

